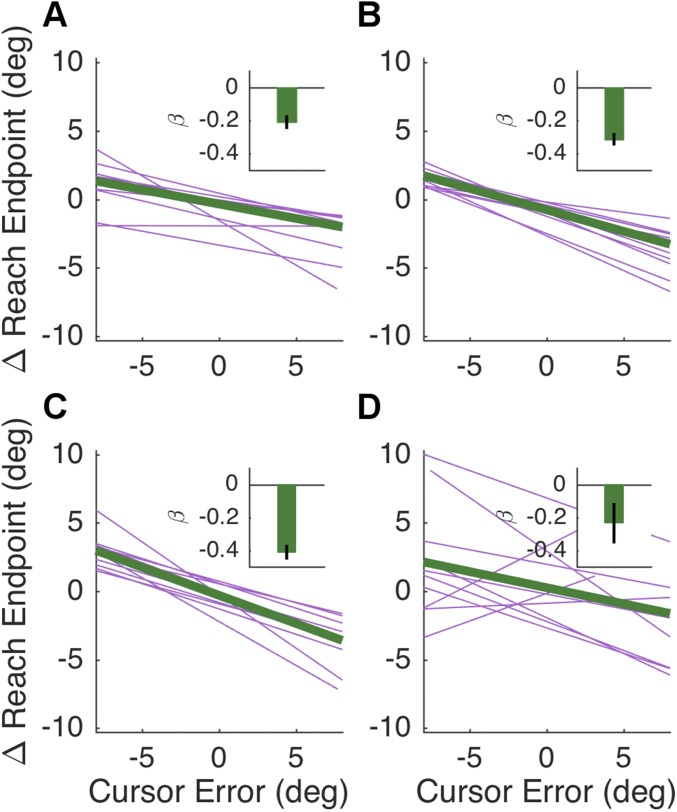
Fig. S4.
Regression analysis for all subjects in the Spatial condition of experiments 2 and 3, using the adaptation metric discussed in Adaptation Analysis. As reported in Results, regression weights were significantly different from zero in both the In-Control condition [A; β = −0.21, t(1,9) = 8.33, P < 0.001] and the No-Control condition [B; β = −0.31, t(1,9) = 5.07, P < 0.001]. In experiment 3, regression weights were significantly different from zero in the control participants [C; β = −0.41, t(1,9) = −9.20, P < 0.001] and the patient sample [D; β = −0.24, t(1,9) = 1.92, P < 0.05]. The group difference was marginally significant [t(1,18) = 1.35, P = 0.09]. Insets depict mean regression coefficients with one SEM.

