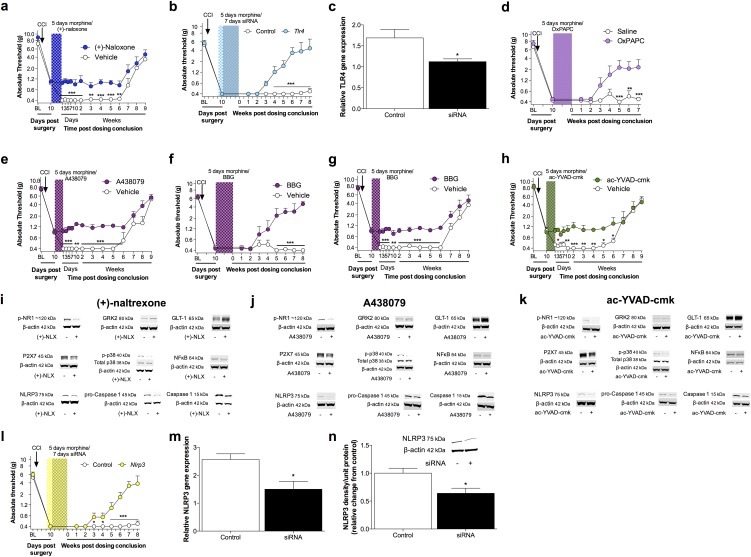
Fig. S5.
(A) The TLR4 antagonist (+)-naloxone (blue hatch; 5 d) was coadministered with morphine (5 d; shaded area), 10 d after CCI surgery, and absolute thresholds for mechanical allodynia were quantified in SD rats. (B) fTlr4 siRNA (7 d, beginning 8 d after CCI; green hatched bar) and morphine (5 d, beginning 10 d after CCI; shaded area) were administered, and absolute thresholds for mechanical allodynia were quantified in F344 rats. (C) Expression of TLR4 mRNA after Tlr4 siRNA. (D) The TLR2/4 antagonist OxPAPC (purple hatch; 5 d) was coadministered with morphine (5 d; shaded area), 10 d after CCI surgery, and absolute thresholds for mechanical allodynia were quantified in F344 rats. (E) The P2X7R antagonist A438079 (purple hatch; 5 d) was coadministered with morphine (5 d; shaded area), 10 d after CCI surgery, and absolute thresholds for mechanical allodynia were quantified in SD rats. (F and G) The P2X7R antagonist Brilliant Blue G (purple hatch; 5 d) was coadministered with morphine (5 d; shaded area), 10 d after CCI surgery, and absolute thresholds for mechanical allodynia quantified in F344 (F) and SD rats (G). (H) The caspase-1 inhibitor ac-YVAD-cmk (green hatch; 5 d) was coadministered with morphine (5 d; shaded area), 10 d after CCI surgery, and absolute thresholds for mechanical allodynia quantified in SD rats. (I–K) Respective levels of phospho-NR1, GRK2, GLT-1, P2X7R, phospho-p38/total p38 ratio, NF-κB (p65 subunit), NLRP3, procaspase-1, and caspase-1 were quantified after treatment with (+)-naloxone (I), A438079 (J), or ac-YVAD-cmk (K). Representative blots are presented. (L) Nlrp3 siRNA (7 d, beginning 8 d after CCI; yellow hatched bar) and morphine (5 d, beginning 10 d after CCI; shaded area) were administered, and absolute thresholds for mechanical allodynia were quantified in F344 rats. (M and N) Expression of NLRP3 mRNA (M) and protein (N) after Nlrp3 siRNA. *P < 0.05; **P < 0.01; ***P < 0.001 (inhibitor vs. control). Data are presented as mean ± SEM; n = 6 or 7 per group.

