Fig. 5.
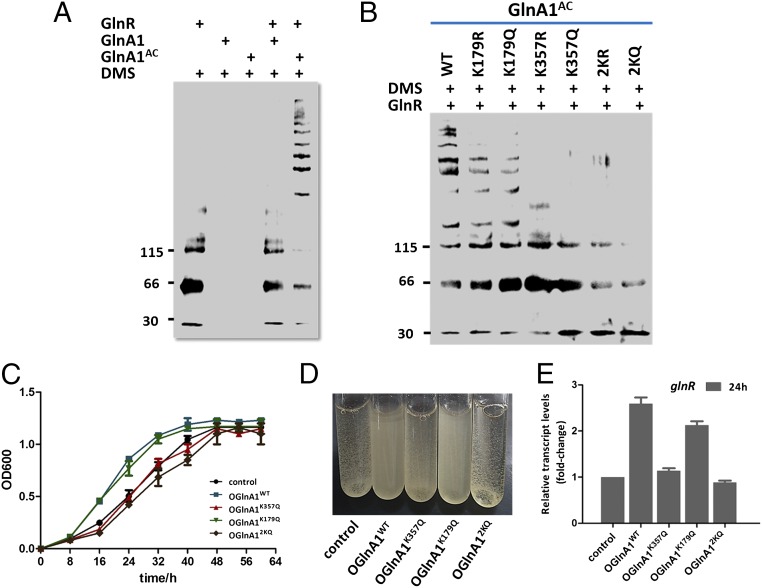
Effect of acetylation on GlnA–GlnR interaction and cell growth. Cross-linking reactions containing the indicated components were separated by SDS polyacrylamide gel electrophoresis and evaluated by Western blotting with anti-GlnR antiserum. GlnR and GlnA1 were used at concentrations of 1 and 20 μM, respectively. (A) Cross-linking with native GlnA1 or GlnA1AC. (B) Cross-linking with GlnA1AC or mutated GlnA1 (K179R, K179Q, K357R, K357Q, 2KR, or 2KQ). Molecular size markers are shown to the left (in kDa). Representative images are shown. (C) Growth curves of S. erythraea strains overexpressing WT or mutant glnA1 cultured with 2 mM NH4Cl as the sole nitrogen source. S. erythraea without glnA1 overexpression was used as a control. (D) Images were captured at 24 h (exponential growth phase). (E) Transcriptional profiles of the glnR gene at 24 h. The relative expression of the glnR gene in the WT strain (control) was set to 1.0. Error bars show the SDs of three independent experiments.

