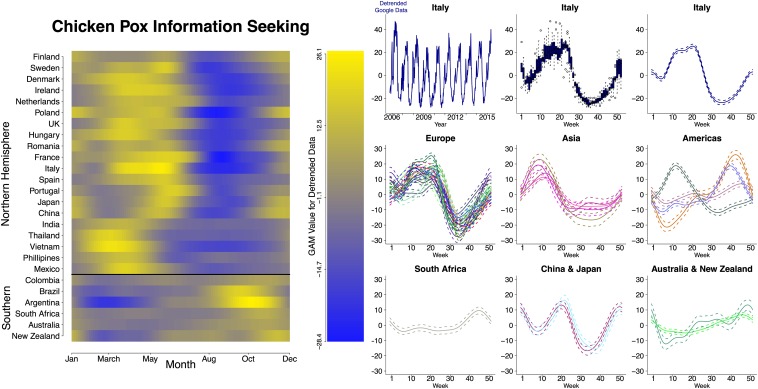
Fig. 1.
(Left) Global seasonality of chicken pox outbreaks measured using Google Trends as a proxy for chicken pox dynamics. Countries are organized by geographic region and latitude. Latitudinal variation in seasonal chicken pox information-seeking behavior was observed for countries with wavelet-confirmed significant seasonality. The seasonality was estimated by fitting a general additive model (GAM) to the detrended Google data from each country. GAM values using week number as the predictive variable for Google data are shown in the heat map and correspond to the GAM curves to the right. (Right) Data processing and regional GAM values. (Top Row) Data processing steps: Detrended Google data for Italy (Top Left) and box-and-whisker plot of Google data for Italy (Top Center) in which the first to third quartiles are shown in solid color with whiskers representing 95% confidence intervals. All other panels represent GAM values using week number as the predictive variable for Google data in each country. European countries include Finland, Sweden, Denmark, Ireland, Netherlands, Poland, the United Kingdom, Hungary, France, Romania, Italy, Spain, and Portugal. Asian countries include Vietnam, India, Thailand, and the Philippines. Americas include Mexico (with a peak in week 10), Colombia, Brazil, and Argentina.

