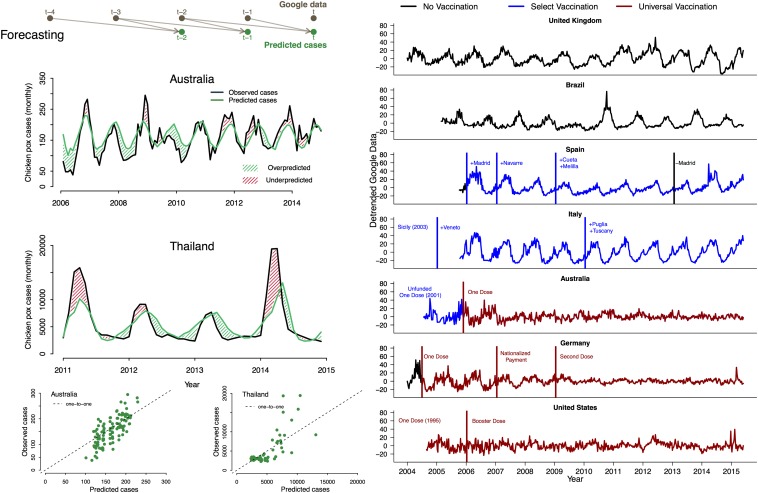
Fig. 3.
(Left) Forecasting chicken pox cases using Google Trends. (Top Left) Forecasting model schematic, Google Trends data from months and are used to predict chicken pox cases in month t. (Middle Left) Observed and predicted chicken pox cases in Australia (active immunization) and Thailand (no immunization) from 10,000 simulations of the fitted models parameterized with the maximum likelihood estimates; overpredicted (green hash marks) and underpredicted (red hash marks) regions are indicated. (Bottom Left) Model predicted cases vs. observed chicken pox cases along the dotted 1-to-1 line. (Right) Detrended chicken pox information seeking in relation to immunization. Data are weekly; x axes indicate time, and y axes are the detrended Google data (same scale for all panels). Countries with universal (national) immunization are highlighted in red, countries with select (regional or municipal) immunization are highlighted in blue, and countries lacking any mandatory immunization are highlighted in black. (Panels 1 and 2, starting from the top) The United Kingdom and Brazil, two countries with no immunization. (Panels 3 and 4) Spain and Italy, two countries with no universal (national) immunization, but with select regional or municipal immunization. Vertical lines identify the implementation (blue for select, red for national) or termination (black) of immunization efforts. Cities and regions in these panels indicate where these efforts were focused. (Panels 5 and 6) Australia and Germany, two countries that implemented national immunization in 2004. Australia has had the vaccine since 2001, but nationwide immunization was not funded by the government until November 2005. Germany required a single dose for every child in July 2004, provided nationalized payment in 2007, and required a second dose in 2009. (Panel 7) The United States, which has had national immunization since 1995, required a booster dose in 2006.

