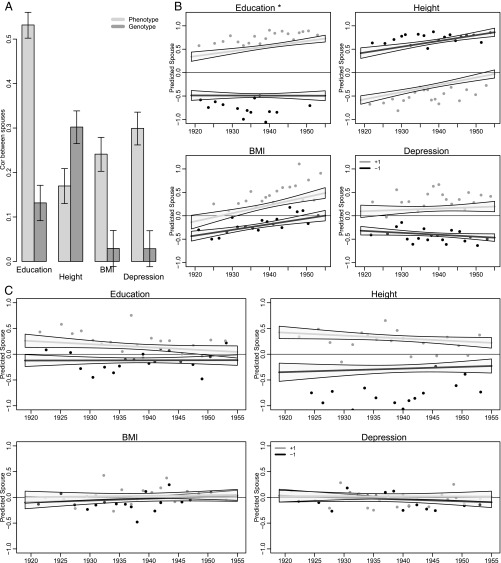
Fig. 1.
Spousal associations for both standardized phenotypes and standardized polygenic risk scores among spousal pairs in the HRS, 2012 (n = 4,686; restricted to respondents in their first marriage who have genotypic data and valid phenotypic responses). (A) All birth cohorts pooled. (B and C) Trends in spousal correspondence across birth cohorts. The horizontal axis depicts birth cohort, whereas the vertical axis is the predicted value for the spouse of a focal individual conditional on the focal individual’s birth year and either phenotype or PGS (Eq. 1). The lines show fitted values for those at 1 SD above (gray) and below (black) the mean. Points are based on binned means for two groups of respondents (standardized value below −1, black; standardized value above 1, dark gray). For each group, the distribution of birth years is divided into 20 subgroups with approximately equal numbers. Plotted points are the mean birth year and response for these subgroups. B considers standardized phenotypes. Education demonstrates a change in spousal correlation across birth cohorts. Consider education in B: an individual with relatively low education is predicted to have a spouse of consistently low education across all birth cohorts. In contrast, a high-education individual will have, on average, a spouse with higher education in later birth cohorts compared with earlier birth cohorts. For height, the fact that relatively short individuals are predicted to marry relatively tall individuals is a consequence of the fact that we are looking at opposite sex pairs. C considers standardized PGSs. In contrast to results for phenotypes, spousal correlations in education PGS display reductions across 20th century birth cohorts as do those for height, although these results do not appear significant at conventional α levels.

