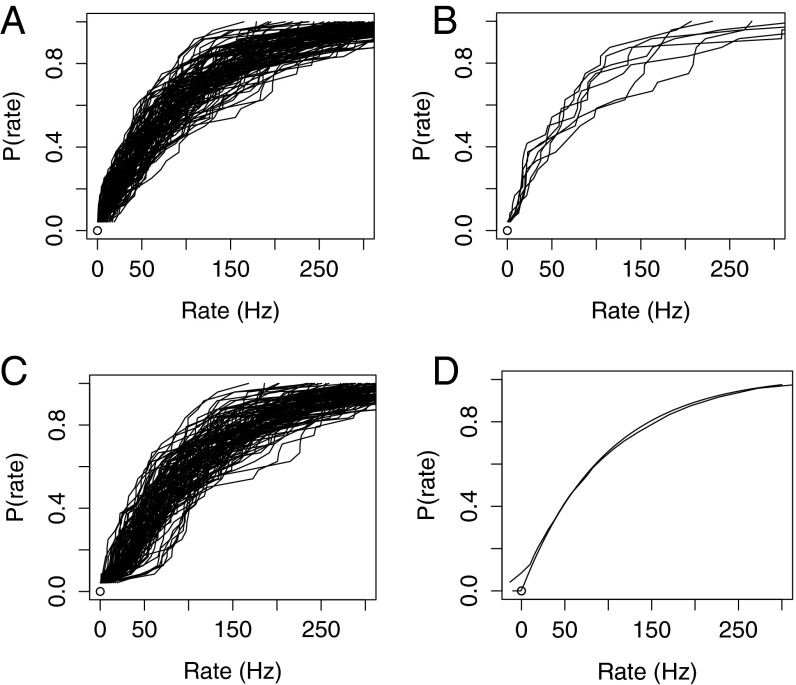
Fig. 3.
(A) The 110 histograms, each based on 24 rates distributed according to an exponential distribution with a mean rate of 100 Hz. (B) Six individual histograms from A (every 18th). (C) The 110 histograms generated according to an exponential distribution with the two ORNs with the slowest firing ORNs given a randomly selected background firing rate. (D) The average of the 110 histograms in C with an exponential distribution superimposed as in Figs. 1D and 2D.

