Significance
We develop a statistical model for the evolution of the network of leading Irish company directorates over 11 years, before and after the financial crisis of 2008. We focus on company interlocks, whereby a director simultaneously sits on more than one company board. Our analysis indicates that the level of director interlockingness increased from 2003, reaching a peak in 2009, and has generally stabilized since then.
Keywords: Bayesian estimation, corporate governance, Ireland, Markov chain Monte Carlo, social network analysis
Abstract
We analyze the temporal bipartite network of the leading Irish companies and their directors from 2003 to 2013, encompassing the end of the Celtic Tiger boom and the ensuing financial crisis in 2008. We focus on the evolution of company interlocks, whereby a company director simultaneously sits on two or more boards. We develop a statistical model for this dataset by embedding the positions of companies and directors in a latent space. The temporal evolution of the network is modeled through three levels of Markovian dependence: one on the model parameters, one on the companies’ latent positions, and one on the edges themselves. The model is estimated using Bayesian inference. Our analysis reveals that the level of interlocking, as measured by a contraction of the latent space, increased before and during the crisis, reaching a peak in 2009, and has generally stabilized since then.
In the past two decades, Ireland has seen big changes to its economic prosperity. From the mid-1990s to 2007, there was a period of rapid economic growth, often referred to as the Celtic Tiger. However, in 2008, there was a major financial and banking crisis that had a devastating effect on the economy and was associated with a series of banking scandals. Since then, there has been considerable interest in ascertaining the roots of the crisis.
Interlocking directorships have been identified as one possible factor in the Irish economic crash (1), possibly contributing to “group think” in the economy and lack of autonomy of individual companies. This possibility is in line with more general literature, which suggests that interlocking directorships may be associated with poorer performance and lower value of companies (2–5), social embeddedness that limits their effectiveness (6), excessive remuneration of directors (7, 8) and conflicts of interest, lack of commitment of directors, and lack of diversity (9, 10).
In this article, we use bipartite networks to investigate interlocking directorships in companies listed on the Irish Stock Exchange (ISE) between 2003 and 2013 inclusive. Bipartite networks have two node types such that two nodes can be linked only if they are of different types. Here, one set of nodes consists of the directors who fill board positions and the other consists of the boards themselves, each of which corresponds to a unique company or organization.
We develop a dynamic statistical model which captures key features of the evolution of interlocking directorships over time. Our data cover the period from 2003 to 2013, allowing an investigation of network behavior in the years before and after the crisis. A key aspect of the model that we develop is that it allows for a statistically principled visual representation of the network’s evolution over time. Clancy et al. (1) examined Irish interlocking directorates, but over a shorter period from 2005 to 2007, which did not cover the financial crash, and they did not carry out any formal statistical modeling.
The modeling task for the type of data we consider has two primary goals. First, we aim to capture patterns of interaction between directors and companies within a given year. Second, we model the temporal evolution of the network and so would like to capture persistence in the interlocking board behavior over time.
Latent space models have been developed for static one-mode networks (11–15). By one-mode, we mean that network contains one node type, with directed or undirected links between different nodes. Statistical models have also been developed for dynamic social networks evolving in time (16–19). Among these models (16) extended the latent space model of ref. 11 to allow for networks that evolve over time by allowing the latent positions of the nodes to change according to a random walk.
Several models have been proposed for static bipartite networks and cooccurrence data (20). Models for dynamic data of this type have also been proposed (10, 21, 22).
The latent space model we develop is for dynamic bipartite networks. The approach most similar to the one we adopt here is that of Sarkar et al. (23), which is a dynamic adaptation of the latent space model for cooccurrence data of Globerson et al. (24). Sarkar et al. (23) examined cooccurrences of words and authors in text corpora. The model used attaches a latent position in a low-dimensional real space to each word and author. It models the probability of cooccurrence of words and authors using the empirical distribution of word and author occurrences and a decreasing function of the distance between their latent positions. An advantage of this model is that it does not make any assumption about the distributions of ties directly, allowing natural modeling of cooccurrence counts through only the empirical distribution of author/word occurrences.
We model evolution over time of the ties between nodes using a Markov model, extending the model of Sarkar and Moore (16), who assumed the nodes to be independent given the latent positions. We found that the conditional independence assumption misses the persistence in links observed in our director board membership network, due to directors retaining a board position for a number of consecutive years. The model we propose does account for this persistence.
Methods
Data.
A list of all Irish-based companies listed on the ISE from 2003 to 2013 was obtained from the Exchange. The company registration office number and address of each of the remaining companies was obtained from the Irish Companies Registration Office website. Hence, for each company, a list of their directors was found. The data collected were rearranged into a bipartite dynamic graph, whereby for each year edges between directors and companies were created according to boards’ compositions. The network was made up of 1,009 directors, 91 companies, and 4,952 edges. Because the main focus of our analysis is the study of director interlocks, we removed those companies that did not involve any interlocking links over the study period, in other words, those companies that did not share any of their directors with any other board over the 11 years of the study. The resulting dataset (corresponding to 761 directors, 59 companies, and 3,855 edges) was used to carry out our analysis. Only 22 of the companies were quoted on the ISE for the entire time period considered, whereas all other companies either joined at a later stage or left early or both. There was also a significant number of directors who sat only on one board, sometimes for only a year. These directors can be seen as peripheral to the Irish network of boards and directors. Table 1 gives an overview of the number of directors and boards in each year of the study.
Table 1.
Number of active companies and directors in each year and proportion of these that were interlocked directors
| Year | No. of companies | No. of directors | No. of interlocked directors | Proportion |
| 2003 | 36 | 347 | 23 | 0.066 |
| 2004 | 36 | 349 | 23 | 0.066 |
| 2005 | 36 | 335 | 23 | 0.069 |
| 2006 | 39 | 356 | 23 | 0.065 |
| 2007 | 43 | 363 | 30 | 0.083 |
| 2008 | 41 | 351 | 29 | 0.083 |
| 2009 | 39 | 318 | 33 | 0.104 |
| 2010 | 37 | 318 | 33 | 0.104 |
| 2011 | 35 | 296 | 27 | 0.091 |
| 2012 | 29 | 261 | 17 | 0.065 |
| 2013 | 29 | 249 | 15 | 0.060 |
Interlocked directors were those sitting on two or more boards in that year.
Exploratory Analysis.
An interlocked director in any given year is a director who sits on two or more boards in that same year. It can be seen from Table 1 that the proportion of interlocked directors increased from 2006 to 2010 and declined from 2011 to 2013.
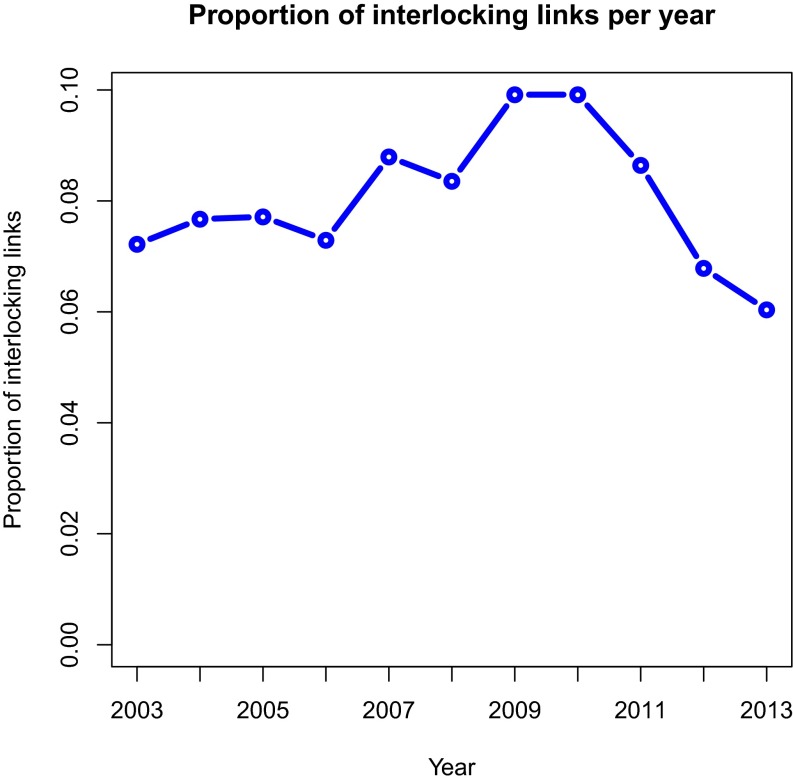
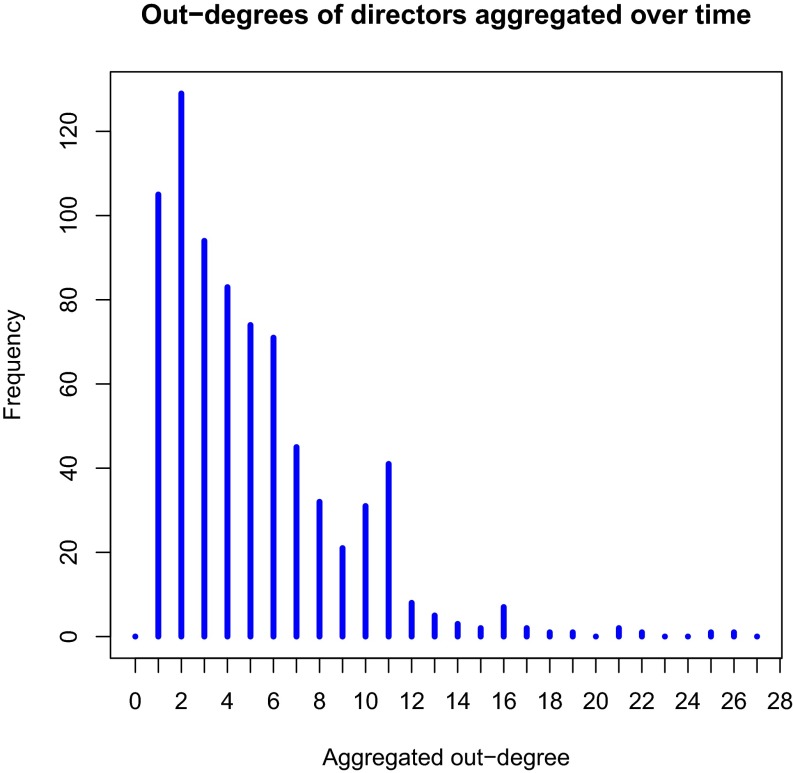
The number of interlocking links for a node is related to the excess degree, defined as follows: for a director with degree d, it is equal to if or 0 otherwise. Fig. 1 gives further evidence that the proportion of interlocking links increased over time until around 2010 and subsequently declined. Finally Fig. 2 presents a histogram of the out-degree distribution (aggregated over time) for directors, displaying a heavy right tail indicating that some directors have many links over the course of the study.
Fig. 1.
Evolution of the proportion of interlocking links throughout the study. The interlocking proportion increased before and during the crisis, subsequently declining from 2010 to 2013.
Fig. 2.
Histogram of out-degrees of directors aggregated over time indicating that some directors possess many connections throughout the time period analyzed.
A Dynamic Latent Space Model for Interlocking Boards.
The network is described by the adjacency cube whose elements are defined as
for . To model the dynamic evolution of the bipartite network one could use a continuous-time framework (10). However, in the context of Irish interlocking directorates, we observe the board memberships on the last business day of each year, so each adjacency matrix represents a one-year aggregate snapshot of the boards and their directors. We use the term “aggregate” to describe the observed networks, but in reality, the boards of public limited companies are quite stable and it would be unusual for a director to serve less than one full term (a year). Thus, it is more natural to view the observations as equally spaced, and we make this assumption when formulating our model.
We use a latent space approach to model the positions of companies and their directors over time. This approach uses the idea that the positions of companies and their directors lie in a D-dimensional latent Euclidean space, so that a director which lies close to a company will tend to sit on that company board. We denote latent director and company positions at time by and , respectively. An additional important aspect of our model is the inclusion of a edge persistence parameter, , which models the fact that once an edge is formed at time t, it may persist over time. We similarly include a nonedge persistence parameter, to capture the fact that a nonedge at time t also typically persists over time. Separating the edge and nonedge persistences is an important facet of our model, because the observed temporal bipartite graph is sparse and the effect of persistence of edges and nonedges is markedly different, as can be seen in Results and Discussion. Conditional on these latent positions, the log-odds of director i sitting on board j in year t is
| [1] |
In fact, we found for the Irish boards data that modeling changes in director positions over time gave little extra information but was considerably more computationally demanding; hence, these are kept fixed. The persistence feature is included through the combination of the intercepts and depending on whether an edge or a nonedge, respectively, is observed between nodes i and j at time t. If the state of the edge in the previous time frame is not known, the quantity is substituted by a hyperparameter , equal to the graph density. To summarize, the likelihood parameters are: the observed adjacency cube , an matrix representing directors’ latent positions, an cube of boards’ positions and two T-dimensional vectors and for the intercepts.
We account for the missing data by considering the contribution of boards only in those years where they are quoted in the ISE. As a matter of fact, from 2003 to 2013, no boards joined or left the ISE more than once. Hence, for each board the period of activity is made up of consecutive years only. A similar reasoning is applied to directors, whereas their contribution to the likelihood is considered only in the years where they sit on one board at least. The rationale leading to this simplification is that the likelihood information used to estimate positions is mainly carried by edges that are present rather than those that are missing. Hence, we speculate that neglecting the contribution of inactive boards and directors does not cause relevant changes in our conclusions.
Therefore, we express the likelihood of the network as
| [2] |
where denotes the set of active boards (directors, respectively) at time t.
Bayesian Model.
We formulate our dynamic latent space model as a Bayesian hierarchical model. We denote by a Gaussian density evaluated at s and with mean μ and variance ν, and by a gamma density evaluated at s with shape u and rate v. We use a random walk model for the boards’ latent positions, specified by
| [3] |
The directors’ positions are assumed to arise independently from a D-variate zero mean Gaussian prior with spherical covariance, hence
| [4] |
Note that the parameters corresponding to inactive boards and directors are included in the prior modeling. The intercept parameters follow a random walk prior:
| [5] |
The precision parameters are all modeled by gamma distributions with common shape a and rate b. (The precision is the reciprocal of the variance.) The remaining parameters are hyperparameters and hence user-specified. The hyperparameters were specified as to reflect a relatively uninformative prior structure.
Markov Chain Monte Carlo (MCMC) sampling was used to sample from the joint posterior distribution of all of the model parameters. One issue is that the likelihood is invariant to rotations, reflections, and translations of the latent positions, because the likelihood depends on the latent positions through the distances for all . To account for this source of model nonidentifiability, we apply Procrustes matching. Details of the MCMC algorithm and the Procrustes matching are given in the SI Appendix.
Quantifying the Extent of Interlockingness.
Quantifying the extent of interlockingness in a network of companies and directors may be of interest to policy makers and the public, especially in the aftermath of the economic crises in Ireland and beyond. A useful byproduct of the output of our statistical model is that the distribution of latent positions can be used to derive a metric of interlockingness in each year. In fact, we expect that directors located near the center of the space will more likely sit on more than one board, whereas those having a peripheral position will tend to have fewer connections. Equivalently, the centrality of boards affects the interlocking level of the network in the same way. For this reason, we assess the variation of interlocking through the empirical variance of boards, which may be computed for each iteration of the MCMC algorithm at each time , as
| [6] |
where and dash refers to matrix transposition.
Model Choice.
We also compare our model with two simpler models for the same data. The three models are as follows:
Model 1: the model described in this section.
Model 2: a special case of Model 1, where the latent distances are all set to zero. Eq. 1 therefore simplifies to
| [7] |
Model 3: a special case of Model 1, where the persistence feature is omitted. Therefore, the log-odds of Eq. 1 is expressed as
| [8] |
Model choice is carried out using the deviance information criteria (DIC) (25), which is estimated from the output of the MCMC algorithm.
Results and Discussion
The DIC values for the three competing models are provided in Table 2, along with the number of effective parameters and the actual number of parameters. Our model achieves the lowest DIC and, therefore, we focus on it for the remainder of the analysis.
Table 2.
Model comparisons
| Model | DIC | No. of effective parameters | No. of parameters |
| 1 | 7617.57 | 794.02 | 2,344 |
| 2 | 10097.35 | 16.46 | 26 |
| 3 | 11,372.53 | 1,640.56 | 2,331 |
Estimates of the intercept and precision parameters are shown in Tables 3–5. The precision parameters and all have small values. In particular, the posterior mean of is comparable with the hyperparameter , meaning that the starting positions are quite far apart. This fact is a sign that the data exhibit strong heterogeneity, which is captured using the latent space approach. By contrast, the precision parameters for the innovations and all have high posterior means, meaning that the model is relatively stable over time.
Table 3.
Estimates for gamma
| Year | Mean | SE |
| 2003 | 8.098 | 0.929 |
| 2004 | 8.229 | 0.493 |
| 2005 | 8.145 | 0.446 |
| 2006 | 8.091 | 0.451 |
| 2007 | 7.616 | 0.410 |
| 2008 | 7.937 | 0.451 |
| 2009 | 7.913 | 0.461 |
| 2010 | 7.697 | 0.430 |
| 2011 | 7.225 | 0.396 |
| 2012 | 7.136 | 0.434 |
| 2013 | 7.350 | 0.516 |
Table 5.
Estimates for precisions
| Parameter | Mean | SE |
| 0.031 | 0.004 | |
| 7.209 | 1.998 | |
| 0.031 | 0.033 | |
| 2.286 | 1.292 | |
| 0.532 | 0.53 | |
| 1.602 | 0.71 |
Table 4.
Estimates for beta
| Year | Mean | SE |
| 2003 | 1.32 | 0.089 |
| 2004 | −0.491 | 0.15 |
| 2005 | −0.712 | 0.165 |
| 2006 | −0.481 | 0.136 |
| 2007 | −0.754 | 0.139 |
| 2008 | −1.14 | 0.162 |
| 2009 | −0.761 | 0.15 |
| 2010 | −1.148 | 0.178 |
| 2011 | −1.154 | 0.19 |
| 2012 | −0.381 | 0.175 |
| 2013 | −0.637 | 0.192 |
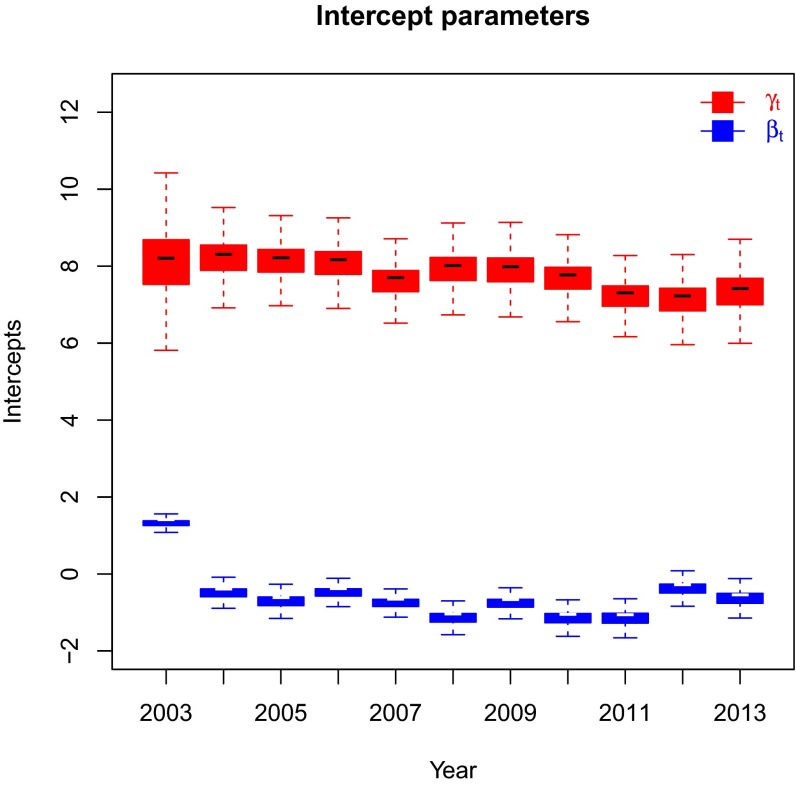
Fig. 3 illustrates the fact that the persistence feature introduced in our model plays an important role because the log-odds for the probability of an edge can be markedly different when the same edge was present in the previous year. The difference in the posterior SDs between the two types of the intercept parameters is a consequence of the network being sparse: more data are available for the estimation of the values, leading to better estimates.
Fig. 3.
Evolution of the intercept parameters . The persistence feature appears to introduce a substantial change: the log-odds that an edge appears increase (approximately) by 8 if the same edge appeared in the previous time frame.
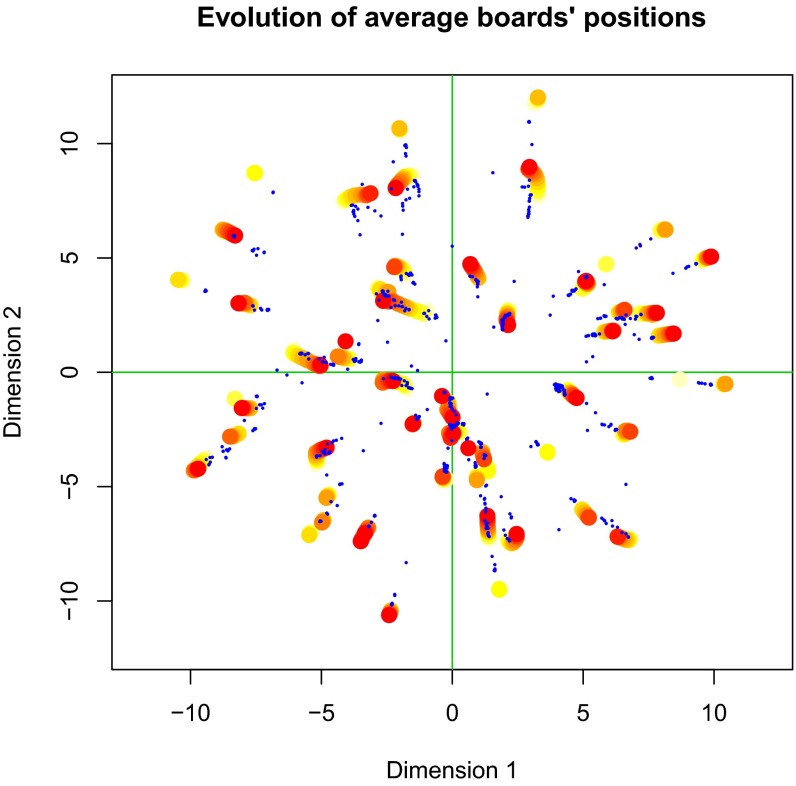
The posterior means of the latent positions of both directors and companies are shown in Fig. 4 by a time-collapsed snapshot. For the boards, a clustering effect can be noted due to the little movement over time, whereas for directors, clusters of points arise due to boards’ compositions remaining relatively unchanged over time. The cluster of companies and directors just below the center of the space corresponds to a higher density region of the graph that includes most of the leading companies of the Irish economy, whereas isolated boards typically are companies with a low market capitalization or a short longevity in the ISE.
Fig. 4.
Evolution over time of average boards’ positions. The years are represented through shifting colors: 2003 corresponds to yellow, whereas 2013 corresponds to red. The small blue dots are the posterior means for directors’ positions.
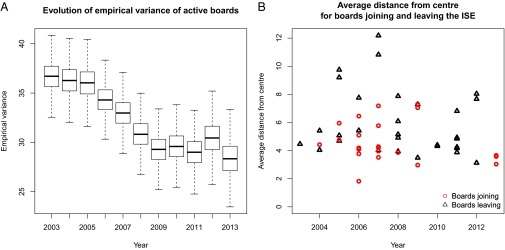
The empirical variance, outlined in Eq. 6, and shown in Fig. 5, Left clearly exhibits a downward trend from 2003 to 2009, signaling a contraction of the latent space. This result is in agreement with the increase of interlocking over this period, as presented in Fig. 1. From 2009 to 2013, the empirical variance index appears to stabilize, coinciding with an upswing in the economy. The motivation behind the contraction of the latent space can be traced back to two main causes: the movement of boards toward the center of the space and the variations induced by boards joining the ISE after 2003 or leaving before 2013 (recall that the empirical variance is evaluated using only active boards). The plot in Fig. 5, Right shows the average distance between the center and board j at the times of its first and last appearance on the ISE, for every . It appears that from 2005 to 2008, several boards located in a peripheral position left the ISE, whereas in the same years some boards joined the ISE in central positions. Another relevant fact arising from the same plot is that three boards joined the ISE in 2013 in central positions, supporting the noticeable decrease of the empirical variance in that year.
Fig. 5.
Analysis of the empirical variance. (A) Evolution of the posterior distribution of the empirical variance in the time period considered in our study. The index decreases until 2009, thereafter remaining relatively stable. (B) Plot showing the average distance from the center for boards joining the ISE after 2003 or leaving before 2013. Companies joining the ISE after 2003 tend to enter in a central position, whereas most boards leaving the ISE from 2005 to 2008 have a peripheral position. This fact contributes to a reduction of the empirical variance and hence suggests a compression of the latent space.
The combination of the evolution of boards’ positions and the changes in the composition of the ISE basket give a reasonable justification for the decrease of the empirical variance and hence for the contraction of the latent space. This finding yields a grounded theoretical support for the increase of interlockingness argued in the paper.
Conclusions
We have proposed a latent space model for dynamic bipartite networks, motivated by Irish corporate board interlocks before and after the 2008 financial crash. The model can capture heterogeneity in the network by means of the latent positions as well as the persistence of links through a modeling structure for intercept parameters. In our application, we have mainly focused on the relation between the variation of interlocking level in the Irish directorates network and the compression/expansion of the latent space. Our model has captured the dynamic evolution of this interlockingness, exhibiting a contraction of the latent space up until 2009 and a stabilization thereafter. This result may provide some support for the view that there are disadvantages to interlocking, and that increasing interlocking may be a warning sign of, and possible contributing factor to future financial instability.
Supplementary Material
Acknowledgments
We are grateful to the reviewers and Katherine Stovel for helpful comments. This research was supported by the Insight Centre for Data Analytics through Science Foundation Ireland Grant SFI/12/RC/2289 (to N.F.); by Science Foundation Ireland Grants 12/IP/1424 (to N.F. and R.R.), 08/IN.1/I1879 (to J.W.), and 11/W.1/I2079 (to A.E.R.); and by National Institutes of Health Grants R01 HD054511 and R01 HD070936 (to A.E.R.).
Footnotes
The authors declare no conflict of interest.
This article contains supporting information online at www.pnas.org/lookup/suppl/doi:10.1073/pnas.1606295113/-/DCSupplemental.
References
- 1.Clancy P, O’Connor N, Dillon K. Mapping the Golden Circle. TASC; Dublin: 2010. [Google Scholar]
- 2.Fahlenbrach R, Low A, Stulz RM. Why do firms appoint CEOs as outside directors? J Financ Econ. 2010;97(1):12–32. [Google Scholar]
- 3.Adams RB, Hermalin BE, Weisbach MS. The role of boards of directors in corporate governance: A conceptual framework and survey. J Econ Lit. 2010;48(1):58–107. [Google Scholar]
- 4.Croci E, Grassi R. The economic effect of interlocking directorates in Italy: New evidence using centrality measures. Comput Math Organ Theory. 2014;20(1):89–112. [Google Scholar]
- 5.Drago C, Millo F, Ricciuti R, Santella P. Corporate governance reforms, interlocking directorship and company performance in Italy. Int Rev Law Econ. 2015;41:38–49. [Google Scholar]
- 6.Davis G. The significance of board interlocks for corporate governance. Corp Gov. 1996;4(3):154–159. [Google Scholar]
- 7.Hallock KF. Reciprocally interlocking boards of directors and executive compensation. J Financ Quant Anal. 1997;32(3):331–344. [Google Scholar]
- 8.Core JE, Holthausen RW, Larcker DF. Corporate governance, chief executive officer compensation, and firm performance. J Financ Econ. 1999;51(3):371–406. [Google Scholar]
- 9.Seierstad C, Opsahl T. For the few not the many? The effects of affirmative action on presence, prominence, and social capital of women directors in Norway. Scand J Manage. 2011;27(1):44–54. [Google Scholar]
- 10.Koskinen J, Edling C. Modelling the evolution of a bi-partite network Peer referral in interlocking directorates. Soc Networks. 2012;34(3):309–322. doi: 10.1016/j.socnet.2010.03.001. [DOI] [PMC free article] [PubMed] [Google Scholar]
- 11.Hoff P, Raftery AE, Handcock MS. Latent space approaches to social network analysis. J Am Stat Assoc. 2002;97(460):1090–1098. [Google Scholar]
- 12.Handcock MS, Raftery AE, Tantrum JM. Model-based clustering for social networks (with discussion) J R Stat Soc Ser A. 2007;170(2):301–354. [Google Scholar]
- 13.Krivitsky PN, Handcock MS, Raftery AE, Hoff PD. Representing degree distributions, clustering, and homophily in social networks with latent cluster random effects models. Soc Networks. 2009;31(3):204–213. doi: 10.1016/j.socnet.2009.04.001. [DOI] [PMC free article] [PubMed] [Google Scholar]
- 14.Raftery AE, Niu X, Hoff PD, Yeung KY. Fast inference for the latent space network model using a case-control approximate likelihood. J Comput Graph Stat. 2012;21(4):909–919. doi: 10.1080/10618600.2012.679240. [DOI] [PMC free article] [PubMed] [Google Scholar]
- 15.Sewell DK, Chen Y. Latent space models for dynamic networks. J Am Stat Assoc. 2015;110(512):1646–1657. [Google Scholar]
- 16.Sarkar P, Moore AW. Dynamic social network analysis using latent space models. SIGKDD Explor. 2005;7(2):31–40. [Google Scholar]
- 17.Snijders TAB. Statistical methods for network dynamics. In: Melia M, Shen X, editors. Proceedings of the LXII Meeting of Italian Statistical Society. CLEUP; Padova, Italy: 2007. pp. 281–296. [Google Scholar]
- 18.Foulds J, DuBois C, Asuncion AU, Butts CT, Smyth P. 2011. A dynamic relational infinite feature model for longitudinal social networks. JMLR Workshop Conf Proc 15:287–295.
- 19.Xu KS, Hero AO. Dynamic stochastic blockmodels for time-evolving social networks. IEEE J Sel Top Signal Process. 2014;8(4):552–562. [Google Scholar]
- 20.Mu T, Goulermas JY. Automatic generation of co-embeddings from relational data with adaptive shaping. IEEE Trans Pattern Anal Mach Intell. 2013;35(10):2340–2356. doi: 10.1109/TPAMI.2013.66. [DOI] [PubMed] [Google Scholar]
- 21.Tang L, Liu H, Zhang J, Nazeri Z. KDD ‘08 Proceedings of the 14th ACM SIGKDD International Conference on Knowledge Discovery and Data Mining. Association for Computing Machinery; New York: 2008. Community evolution in dynamic multi-mode networks; pp. 677–685. [Google Scholar]
- 22.Sun Y, Tang J, Han J, Chen C, Gupta M. Co-evolution of multi-typed objects in dynamic star networks. IEEE Trans Knowl Data Eng. 2013;26(12):2942–2955. [Google Scholar]
- 23.Sarkar P, Siddiqi SM, Gordon GJ. 2007. A latent space approach to dynamic embedding of co-occurrence data. JMLR Workshop Conf Proc 2:420–427.
- 24.Globerson A, Chechik G, Pereira F, Tishby N. Euclidean embedding of co-occurrence data. J Mach Learn Res. 2007;8:2265–2295. [Google Scholar]
- 25.Spiegelhalter DJ, Best NG, Carlin BP, van der Linde A. Bayesian measures of model complexity and fit (with discussion) J R Stat Soc B. 2002;64(4):583–639. [Google Scholar]
Associated Data
This section collects any data citations, data availability statements, or supplementary materials included in this article.


