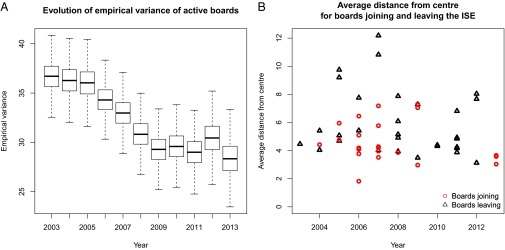
Fig. 5.
Analysis of the empirical variance. (A) Evolution of the posterior distribution of the empirical variance in the time period considered in our study. The index decreases until 2009, thereafter remaining relatively stable. (B) Plot showing the average distance from the center for boards joining the ISE after 2003 or leaving before 2013. Companies joining the ISE after 2003 tend to enter in a central position, whereas most boards leaving the ISE from 2005 to 2008 have a peripheral position. This fact contributes to a reduction of the empirical variance and hence suggests a compression of the latent space.

