
Figure 3. Peptides binding to p53 and their effect on the expression of p53 target genes.
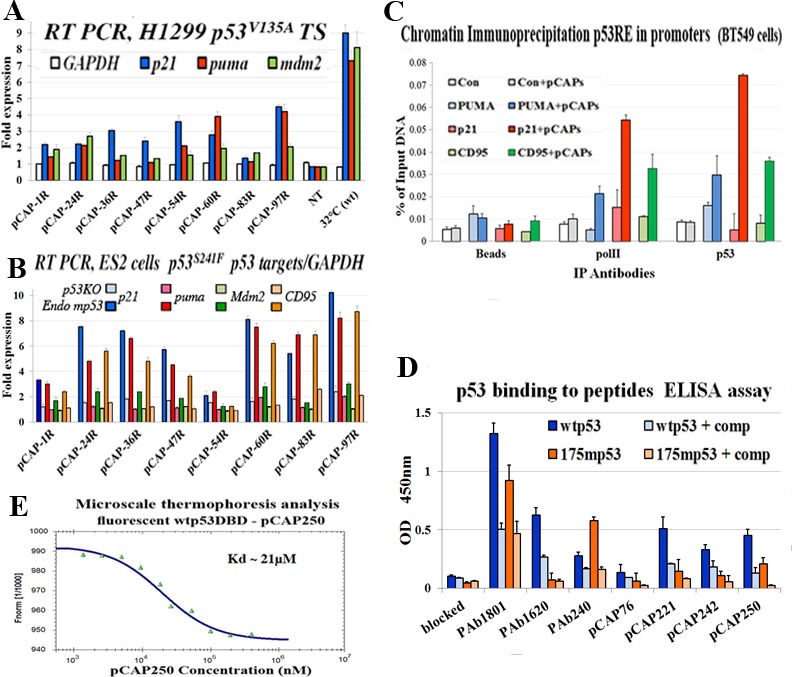
A. - Bar graph illustrating the effect of selected peptides on activation of mutp53 by measuring transactivation of p53 target genes as determined by qRT-PCR. H1299 cells stably transfected with mutp53 (ts) A135V were used. The indicated peptides were added directly to the medium at a concentration of 5ug/ml and cells were then either moved to 32°C or returned to 37°C. 18 hours later cells were harvested, extracted for RNA, cDNA was synthesis subjected to qrt time PCR analysis. The expression level of 3 representative p53 target genes, p21, PUMA and Mdm2, were examined. The figure illustrates the relative fold induction of transcription of the cells treated with the selected peptides as compared to non-treated cells. B. - Bar graph illustrating the effect of selected peptides on activation of mutp53 by measuring transactivation of p53 target genes as determined by qRT-PCR. ES2and ES2-p53KO cells were treated with indicated peptides 5ug/ml, for 18 hours. Cells were harvested, and cDNA was subjected to qRT-PCR analysis. Expression of 4 representative p53 target genes, p21, PUMA, Mdm2 and CD95, was examined. The figure illustrates the relative fold induction of transcription in cells treated with the selected peptides compared to non-treated cells. C. - Binding of mutp53 to promoters of representative p53 target genes in live cells, assessed by chromatin immunoprecipitation. BT-549 breast cancer cells endogenously expressing mutant p53R249S were treated for 5 hours with a mix of 3 pCAPs - 250, 242 and 325. Cells treated with a mix of inert peptides served as a negative control. DNA cross-linked p53 was immunoprecipitated, and binding to the p53 responsive elements of the PUMA, p21, CD95 and MDM2 gene promoters was quantified by qPCR. Results were normalized to input total DNA. Cell extracts immunoprecipitated with beads without antibody (beads) served as negative controls. A genomic segment containing no p53RE served as negative control (white and gray bars). D. - ELISA analysis of the binding of WTp53 and mutp53 to lead peptides. Peptides were conjugated to the bottoms of the wells of 96 well plates, employing a commercial conjugation kit (TAKARA). Control wells were coated with the αp53 monoclonal antibodies PAb1801, PAb1620 and PAb240. Recombinant WTp53 or mutp53R175H was added to the wells and incubated with the bound peptides or antibodies. Where indicated, soluble peptides were added as competitors (+ comp), to confirm the specificity of the binding to p53. pCAP-76 served as a negative control peptide. After removal of recombinant protein, plates were washed and incubated with αp53-HRP followed by TMB and optical density determination. Results are presented as relative absorbance at 450nm. E. - Microscale thermophoresis (MST) analysis of the binding of fluorescently labeled WTp53 DBD and pCAP-250. See Materials and Methods for details.