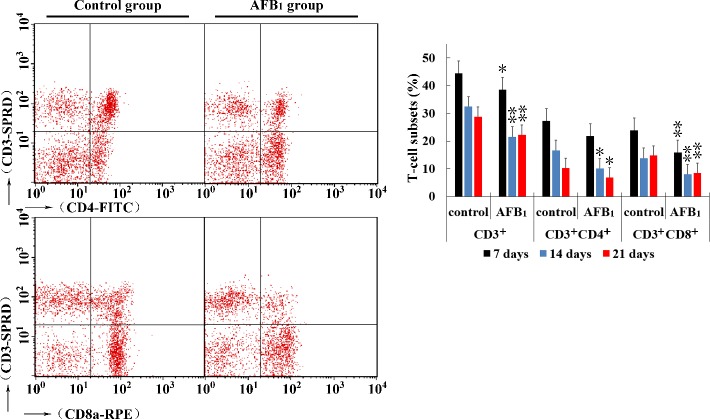
Figure 3. Percentages of CD3+, CD3+CD4+ and CD3+CD8+ T-cell in thymus from the broilers exposed to the control and AFB1 diets.
The average measured percentages of CD3+, CD3+CD4+ and CD3+CD8+ T lymphocytes with representative scatter diagram of the T lymphocyte subsets detected by FCM. Bar graph indicates the mean with standard deviation, and are representatives of the percentages of CD3+, CD3+CD4+ and CD3+CD8+ T lymphocytes of thymus (*p < 0.05, **p < 0.01 vs control), six birds per group.

