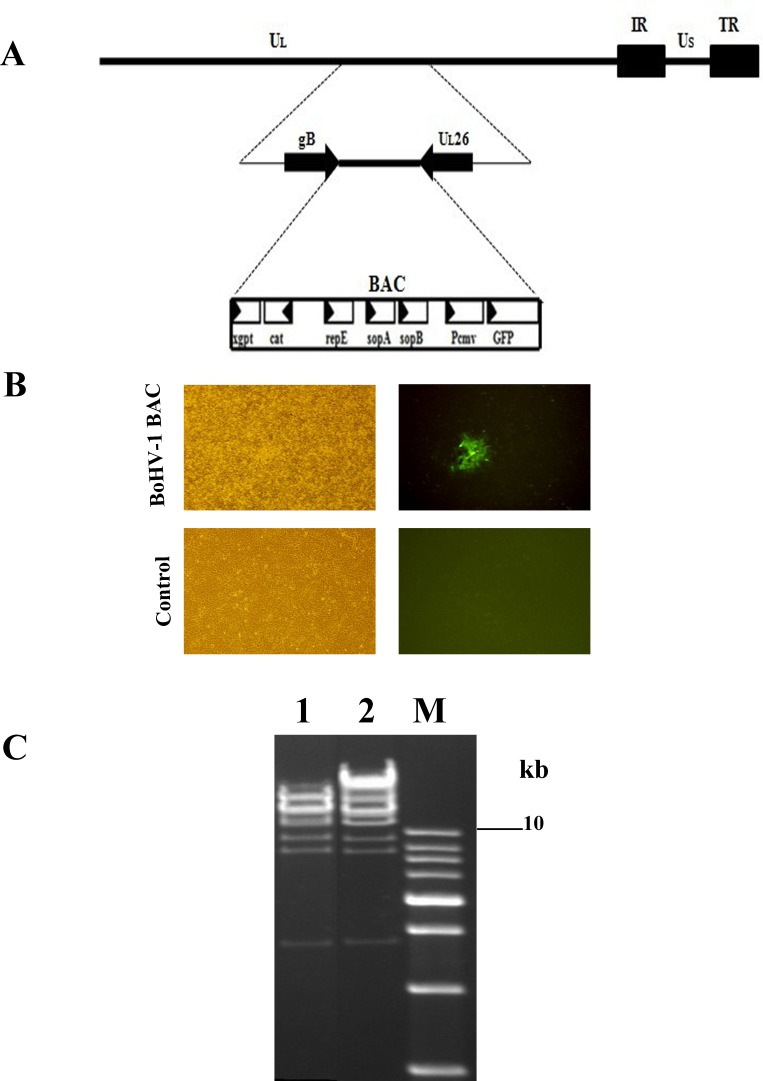
Figure 1.
A. Schematic diagram showing the incorporation of a BAC plasmid within the intergenic region between the gB and UL26 genes of BoHV-1. B. Green fluorescence produced after co-transfection of pMDgB-BAC-UL26 with the wild-type BoHV-1 genome in MDBK cells and control cells. C. BoHV-1 recombinant BAC clones were picked for RFLP analysis. Lane 1, restriction analysis shows a wild-type BoHV-1, while lane 2 shows a BoHV-1 recombinant BAC clone.

