
Figure 1. The distribution of Amot in renal epithelial cells and RCC cells.
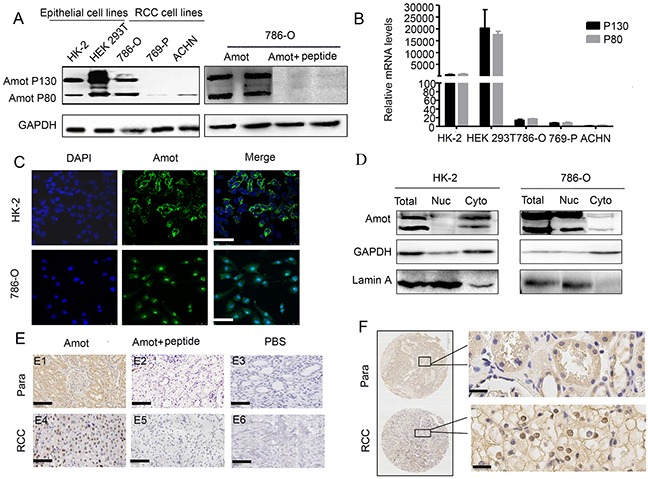
A. Western blot analysis of the relative levels of Amot expression in different epithelial and RCC cell lines (left panel). The specificity of anti-Amot in 786-O cells was analyzed by Western blot (right panel). B. Quantitative RT-PCR analysis of the relative levels of Amot mRNA transcripts in the different epithelial and RCC cell lines. C. Immunofluorescent analysis of Amot expression in HK-2 and 786-O cells. Scale bar = 25 μm. D. Western blot analysis of the distribution of cytoplasmic and nuclear Amot in HK-2 and 786-O cells (Nuc: nucleus; Cyto: cytoplasm). Lamin A was used as a nuclear marker. E. Immunohistochemsitry of Amot expression in human RCC and paracancerous tissues (Para: paracancerous tissues). E1, E4: anti-Amot; E2, E5: anti-Amot and antigen peptides; E3, E6: PBS control; Scale bar = 146 μm. F. Immunohistochemistry of Amot expression in human RCC and paracancerous tissues. Scale = 33μm.