
Figure 2. The distribution of Amot depends on cell density in renal epithelial cells, but not in RCC cells.
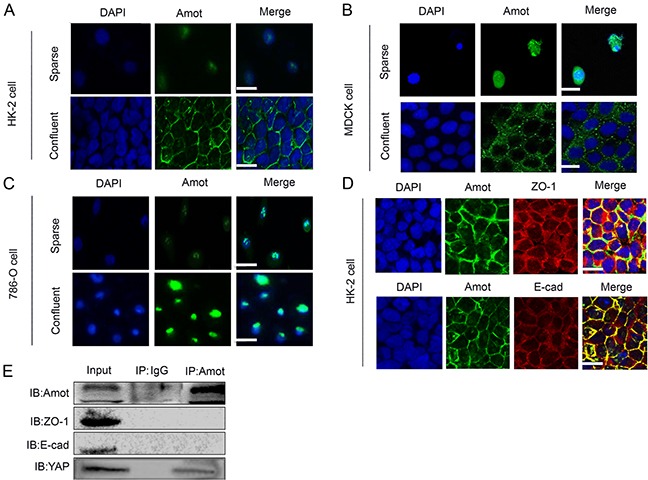
A, B. Immunofluorescent analysis of Amot in HK-2 and MDCK cells cultured in sparse and confluent density. Sparse: 30% density, confluent: 100% density; Scale bar = 25 μm. C. Immunofluorescence of Amot in 786-O cells cultured in sparse and confluent density. Scale bar = 15 μm. D. Immunofluorescent analysis of Amot and ZO-1 or E-cadherin in HK-2 cells. Scale bar = 25 μm. E. Immunoprecipitation (IP) with the anti-Amot antibody and Western blotting analysis of Amot, ZO-1 and E-cadherin interaction in HK-2 cells. Rabbit IgG was used as a negative control and anti-YAP as a positive control.