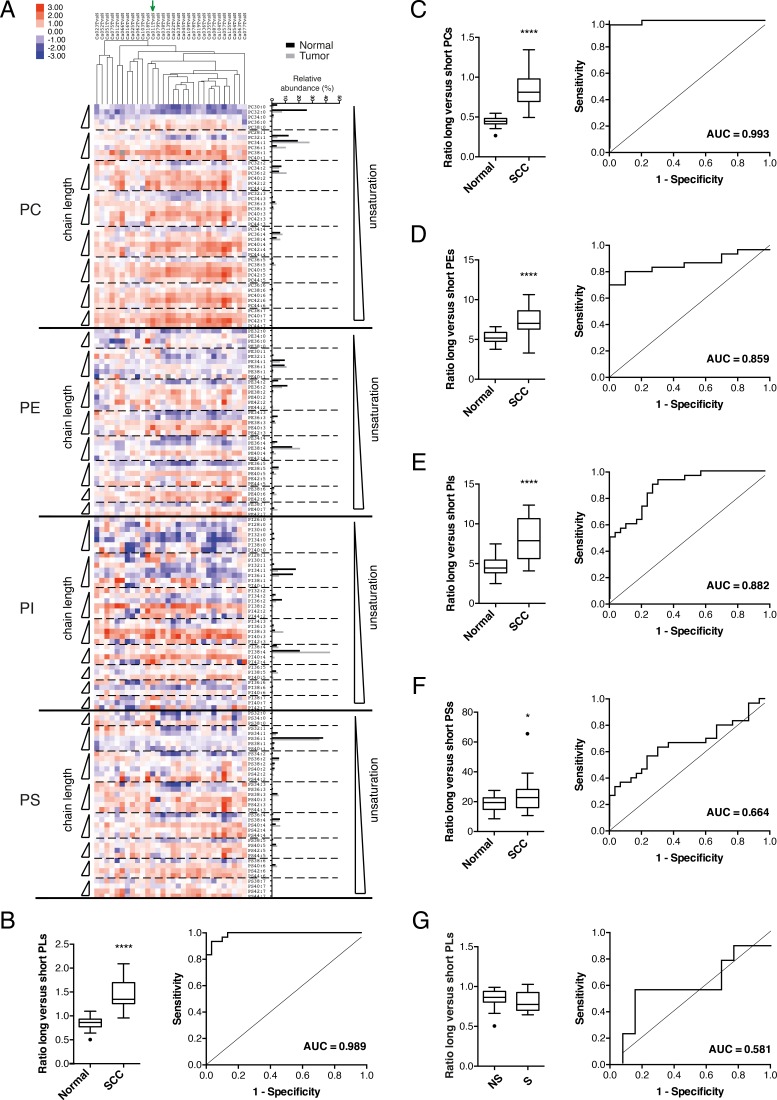
Figure 1. Changes in phospholipid profiles in clinical samples of human lung SCC tumor versus matched normal lung tissue.
A. The relative abundance of individual phospholipid species was measured in lipid extracts from tumor and matched normal tissue from 30 SCC patients using ESI-MS/MS operated in MRM mode. Phospholipids are ordered according to headgroup class (phosphatidylcholine (PC), phosphatidylethanolamine (PE), phosphatidylinositol (PI) and phosphatidylserine (PS)). Within each headgroup class, species are ranked according to the degree of unsaturation (separated from each other by a dotted line) and within each subclass of (un)saturation according to their chain length. Blue squares indicate a decrease in relative phospholipid abundance while red squares represent an increase as indicated by the scale bar (log2 of the ratio). Grey squares indicate missing values. The green arrow indicates the primary tumor from which the 2427PT cell line was derived. On the right the relative abundance of each phospholipid species is shown for a representative SCC tumor and matched normal tissue. Graphs (B-F) show the combined acyl chain length index and corresponding ROC curve and AUC for 30 lung SCCs versus matched normal tissues. The acyl chain length index is calculated as the ratio of the total abundance of B. all phospholipid species (PLs), C. PCs, D. PEs, E. PIs, and F. PSs with longer fatty acyl chains (≥ 36 carbon atoms in the two acyl chains together) versus species with shorter fatty acyl chains (≤ 34 carbon atoms). * p < 0.05; **** p < 0.0001 (Student's test/Wilcoxon test). In graph G., the acyl chain length index (based on all PLs) is calculated for normal tissues from patients who have quit smoking for more than 6 months (NS; n=13) and smokers (S; n=9) at the time of surgery. The corresponding ROC curve and AUC are given. (Mann-Whitney test).

