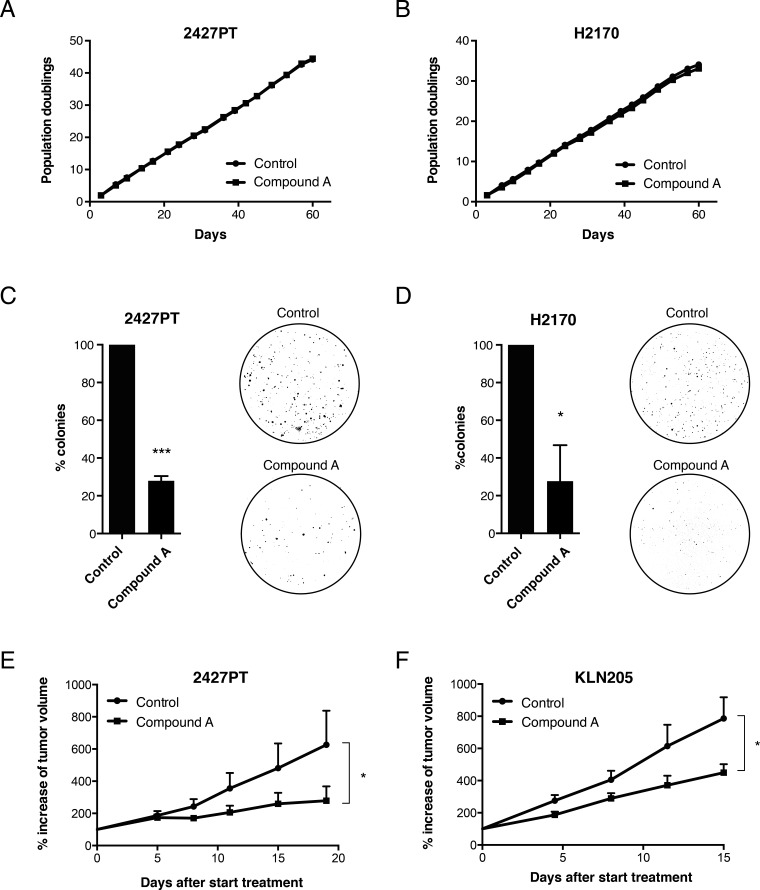
Figure 8. Effect of ELOVL6 inhibition on tumor growth.
The SCC cell lines A. 2427PT and B. H2170 were cultured as monolayers and were treated with Compound A (1 μM) or vehicle for 60 days. Graphs show the cumulative number of population doublings. The SCC cell lines C. 2427PT and D. H2170 were grown in soft agar for 21 days and were treated with Compound A (1 μM) or vehicle. Graphs show the percentage of anchor-independent growth for 2427PT and H2170 cells when treated with ELOVL6 inhibitor versus control cells. Data represent mean (n=3) ± standard deviation. * p < 0.05; *** p < 0.001 (Student's test). E. The SCC cell line 2427PT was subcutaneously injected in NMRI nu/nu mice. After 3 weeks, twice daily administration of Compound A was started versus vehicle. Tumor growth was monitored via caliper measurement twice a week. Data represent mean (n=9-10) ± standard error. * p < 0.05 (Two-way ANOVA with repeated measurements – Sidak's multiple comparisons test). F. The SCC cell line KLN205 was subcutaneously injected in syngeneic DBA/2 mice. Once tumor volume reached ±150 mm3 daily intra-tumoral injection of Compound A was started versus vehicle treated mice. Data represent mean (n=6) ± standard error. * p < 0.05 (Two-way ANOVA with repeated measurements – Sidak's multiple comparisons test).

