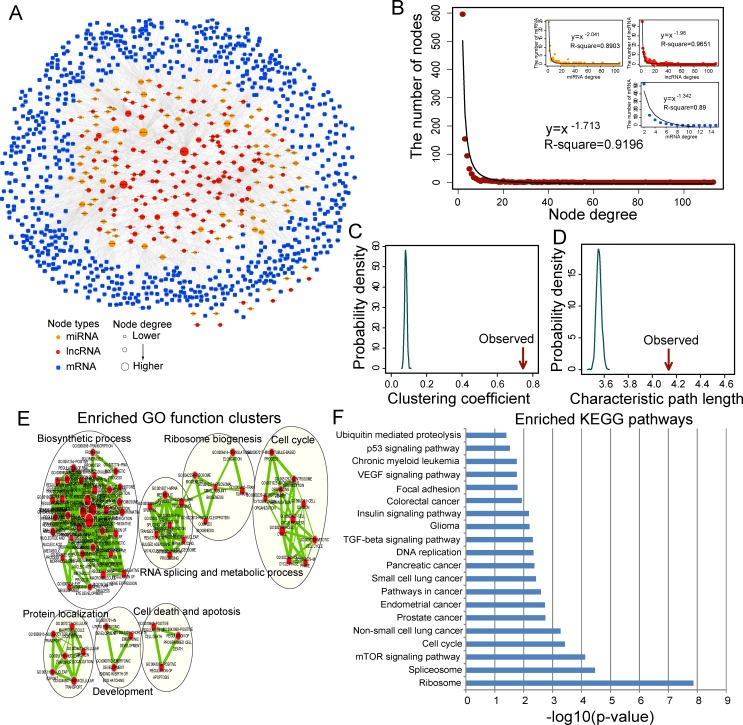
Figure 1. Ovarian cancer-specific lncRNA-associated ceRNA network and their characteristics.
A. Global view of the LCeNET in ovarian cancer. This network consists of 1045 nodes and 2516 links. B. Degree distribution of the LCeNET. C. The clustering coefficient of the LCeNET is higher than randomization test. The arrow represents the clustering coefficient in the real network. D. The characteristic path length of the LCeNET is higher than randomization test. The arrow represents the characteristic path length in the real network. E. The functional enrichment map of GO terms. Each node represents a GO term, which are grouped and annotated by GO similarity. A link represents the overlap of shared genes between connecting GO terms. Node size represents the number of gene in the GO terms. Color intensity is proportional to enrichment significance. F. Significantly enriched KEGG pathway of mRNAs in the LCeNET.

