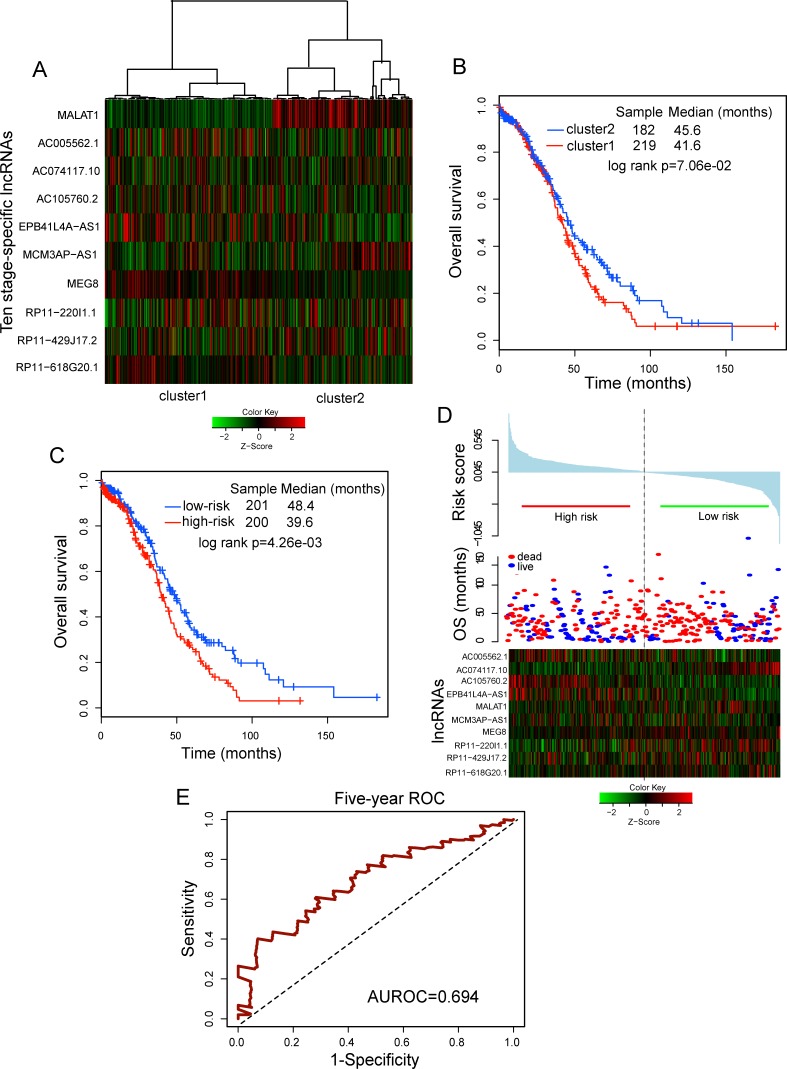
Figure 3. Prognostic value of ten-lncRNA signature for assessing clinical outcome of ovarian cancer.
A. Hierarchical clustering heatmap and dendrogram of ovarian cancer samples based the expression patterns of ten stage-specific HublncRs. B. Kaplan-Meier survival curves for ovarian cancer samples classified into two subgroups using the unsupervised hierarchical clustering strategy. P-Values were calculated using the log-rank test. C. Kaplan-Meier survival curves for ovarian cancer samples classified into high-risk and low-risk groups using the ten-lncRNA signature. P-values were calculated using the log-rank test. D. The ten lncRNA-based risk score distribution, patients' survival status and heatmap of the ten stage-specific HublncRs expression profiles. The black dotted line represents the cutoff value of the risk score derived from the TCGA patients which separated patients into high- and low-risk groups. E. Receiver operating characteristic (ROC) analysis of the risk scores for overall survival prediction in the TCGA dataset.

