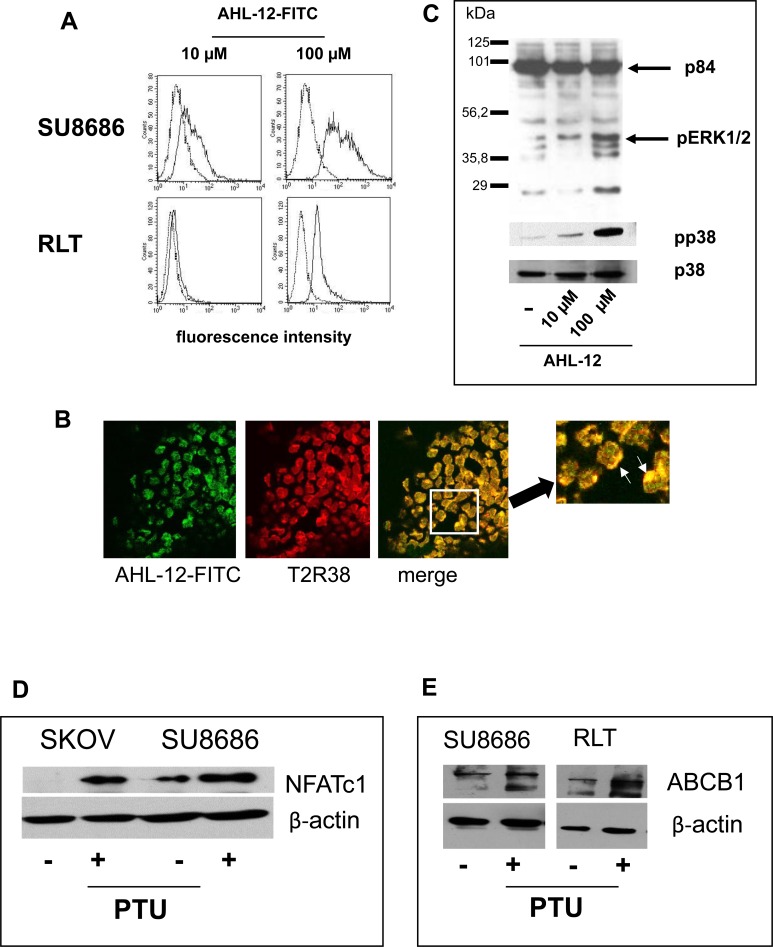
Figure 4. Binding of AHL-12 to cells and activation.
A. Cells were incubated with FITC-labelled AHL-12 for 30 min. at 4°C; the fluorescence associated with the cells was determined. In each panel, auto fluorescence of the cells is shown (left peaks in the histogram), and green-fluorescence (the right peak) indicating AHL-12-FITC binding. B. in a parallel experiments, cells were incubated with AHL-12-FITC and anti-T2R38 (red) and viewed by laser scan microscopy. Co-localisation of AHL-12-FITC with T2R38 was seen (marked on the digital zoom). C. By Western blotting phosphorylation of p38 and pERK (1/2) was seen following stimulation of cells with AHL-12 (shown is p38 and its phosphorylated form pp38; p84 was used as loading control), as was up-regulation of NFATc1 (SKOV: 23.9x; SU8686: 2.8x) D., and of ABCB1 (SU8686: 1.8x; RLT: 2.0x) E. (β-actin was used as loading control).

