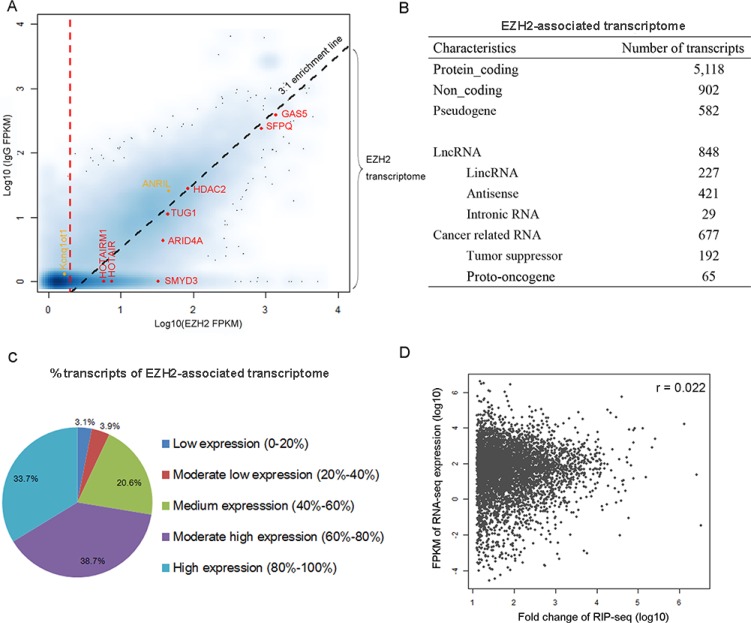
Figure 2. Characterization of EZH2-associated transcriptome in gastric cancer cells.
(A) The scatterplot maps transcripts by their FPKM values in the EZH2-RIP (x axis) and IgG-RIP (y axis). Smoothing was carried out by the function, smoothScatter, in R. Darker shades indicate genes with higher density on the graph. Diagonal dashed line represents the 3:1 EZH2/IgG enrichment threshold. Vertical dashed line represents a cutoff of FPKM [EZH2] = 2. Red, selected transcripts previously suggested to be associated with PRC2. Orange, selected transcripts of known EZH2-associated RNAs but excluded from the EZH2-associated transcriptome in MKN45. (B) Characteristics of the EZH2-associated transcriptome. (C) Composition of the populations of EZH2-associated RNAs expressed at various levels in gastric cancer cells. All genes were ranked by expression level. (D) Correlations between the expression level of RNAs and their enrichment in the EZH2-immunoprecipitated fractions (FC values).

