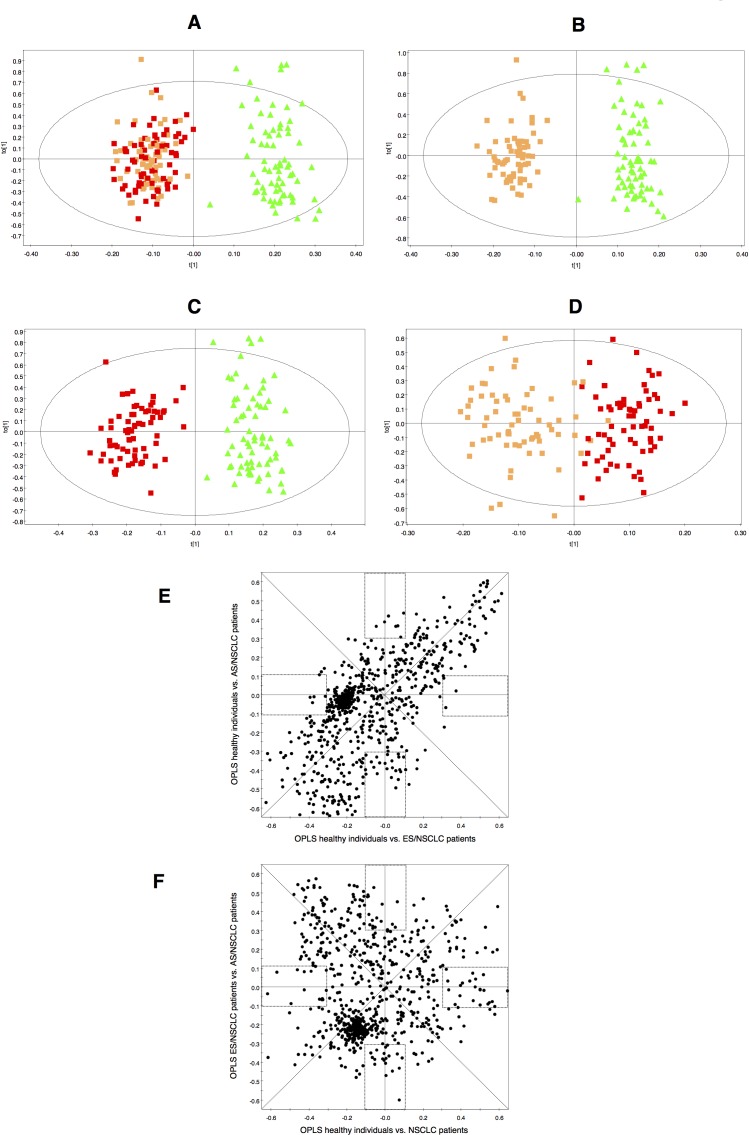
Figure 1. Multivariate modelling resulting from the analysis of serum 1H-NMR spectra.
OPLS-DA score plots for the comparisons between: A. healthy individuals ( ) vs. NSCLC patients (early-stage and advanced-stage,
  and
and  , respectively); B. healthy individuals (
 ) vs. early-stage NSCLC patients (
 ); C. healthy individuals (
 ) vs. advanced-stage NSCLC patients (
 ) and D. early-stage NSCLC patients (
 ) vs. advanced-stage NSCLC patients (
 ). SUS-plots derived from the OPLS-DA models between: E. healthy individuals vs. early-stage NSCLC patients (model B, horizontal axis) and healthy individuals vs. advanced-stage NSCLC patients (model C, vertical axis); F. healthy individuals vs. NSCLC patients (model A, horizontal axis) and early-stage NSCLC vs. advanced-stage NSCLC patients (model D, vertical axis). Rectangles indicate unique biomarkers for each model.

