
Figure 2. Cell viability reduction in ALL cell lines after Nutlin-3a treatment.
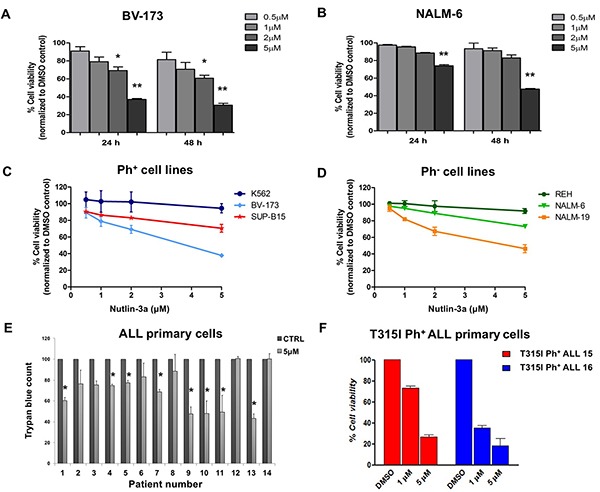
A. BV-173 and B. NALM-6 viability was evaluated by MTS test after treatment with increasing concentrations of Nutlin-3a (0.5 μM, 1 μM, 2 μM, 5 μM) at 24 and 48 hours. Results are expressed as percent viability relative to DMSO-treated controls. The bar-graphs represent mean with S.D. from three independent experiments. Viability of C. Ph+ (BV-173, SUP-B15 and K562) and D. Ph− (REH, NALM-6 and NALM-19) leukemic cell lines was evaluated by MTS test after treatment with increasing concentrations of Nutlin-3a treatment (0.5 μM, 1 μM, 2 μM, 5 μM) at 24 hours. E. Trypan blue count was performed in primary cells, isolated from 9 Ph+ (UPN 1-9) and 5 Ph− (UPN 10-14) ALL patients after 24 hours of Nutlin-3a treatment at 5 μM concentration (or DMSO-control). F. Viability of mononuclear cells isolated from 2 ALL patients (UPN 15-16) harboring T315I mutation was evaluated by MTS test after 24 hours of Nutlin-3a treatment at 1 μM and 5 μM concentrations. Results are expressed as percent viability relative to DMSO-treated controls. The bar-graphs represent mean with S.D. Statistically significant analyses are indicated by asterisks: *p<0.05, **p<0.01.