
Figure 3. Activation of p53-downstream pathway by MDM2 inhibition in ALL cells with wild-type p53.
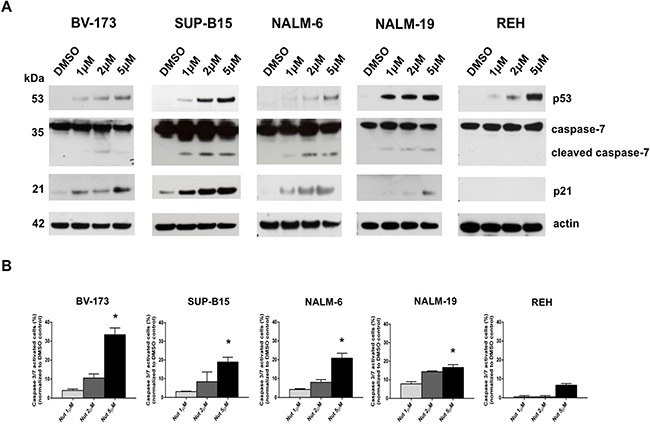
A. Western blot analysis of p53, caspase-7, p21 and actin was performed in BV-173, SUP-B15, NALM-6, NALM-19 and REH cell lines after treatment with increasing concentrations of Nutlin-3a (1 μM, 2 μM, 5 μM) or DMSO control (0.1%) at 24 hours. B. Caspase 3/7 activity assay was performed in BV-173, SUP-B15, NALM-6, NALM-19 and REH cell lines after treatment with increasing concentrations of Nutlin-3a (1 μM, 2 μM, 5 μM) or DMSO control (0.1%) at 24 hours. Statistically significant analyses are indicated by asterisks: *p<0.05.