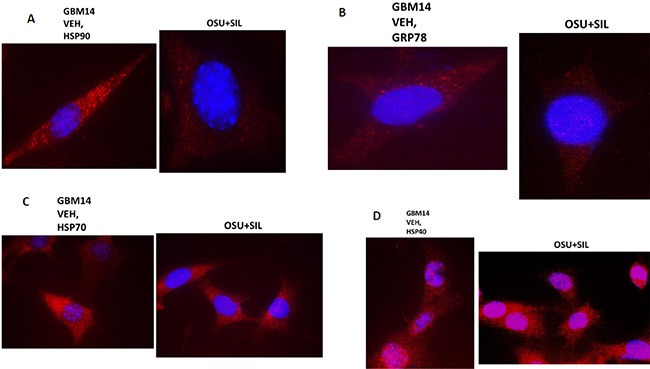
Figure 8. The sub-cellular distribution and morphology of chaperone complexes in cells before and after treatment with [OSU-03012 + sildenafil], Part 1.

(A–D) GBM14 cells were treated with either vehicle control or OSU-03012 (2 μM) and sildenafil (2 μM) for 6 h. Cells were fixed in place and permeabilized using 0.5% Triton X100. Immuno-fluorescence was performed to detect the expression levels of HSP90; GRP78; HSP70; and HSP40, presented at 60X magnification.
