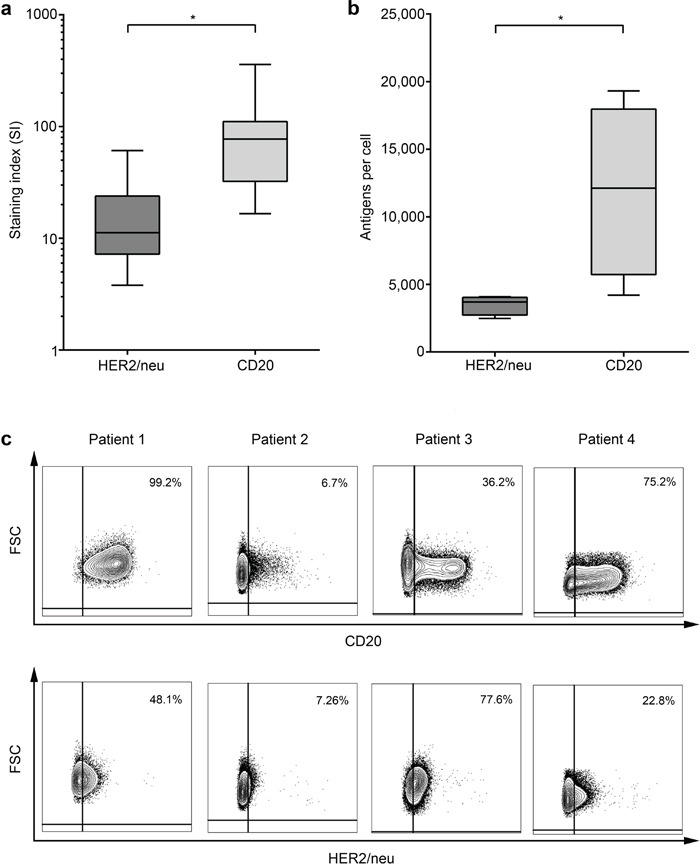
Figure 6. Comparative analysis of CD20 and HER2/neu expression levels on primary ALL blasts.

HER2/neu and CD20 expression on primary ALL blasts at time of initial diagnosis was determined by flow cytometry. a. Staining indices (SI) were calculated using the formula (median fluorescence [positive population] − median fluorescence [negative population] / 2× standard deviation [negative population]). b. Absolute quantification of molecule numbers was performed as described in the methods section. Error bars represent means and SEM. c. The percentage of CD20 and HER2/neu-positive ALL cells within leukemic cells of individual patients as determined by flow cytometry is shown.
