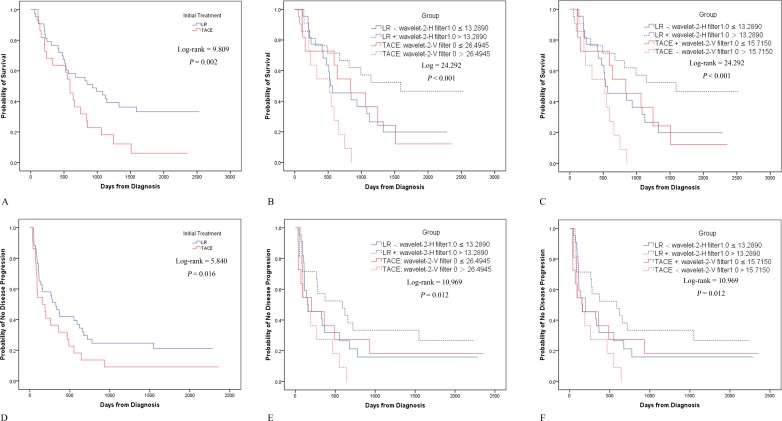
Figure 2. Kaplan-Meier analyses for various subgroups.
Before subgrouping, OS A. and TTP D. showed significant differences between LR and TACE. Upon subgrouping by wavelet-2-H (filter 1.0) in LR and by wavelet-2-V (filter 0) in TACE, LR+ was associated with the best OS, followed by LR- and TACE+; TACE- had the poorest OS B. TTP also showed significant differences, with the TTP of LR+ and LR- being equal to that of TACE+, but better than that of TACE- E. Similar results for OS C. and TTP F. were noted if LR was separated by wavelet-2-H (filter 1.0) and TACE was separated by wavelet-2-V (filter 1.0).

