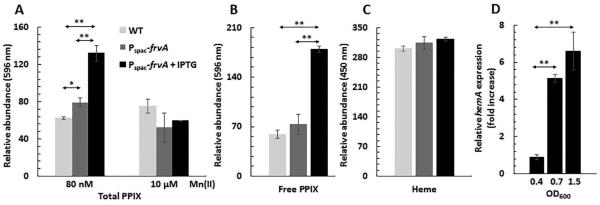
Fig 9. Effects of FrvA on B. subtilis heme biosynthesis.
A. Overnight cultures of WT and Pspac-frvA were subcultured (1:100 ratio) in MOPS metal-limiting minimal medium (MLMM; Chen et al., 1993) supplemented with 80 nM or 10 μM MnCl2. FrvA was induced with 1 mM IPTG at mid-log phase (OD600=0.25) for 3 h. Total protoporphyrin IX (PPIX) was extracted with 2 M oxalic acid. The fluorescence emission of PPIX was scanned from 560 to 680 nm after excitation at 400 nm and fluorescence intensity at 596 nm (peak) was normalized and plotted.
B. Measurements of PPIX in the same strains listed as Fig. 9A by acidic acetone extraction. The fluorescence emission of PPIX was scanned from 500 to 650 nm after excitation at 410 nm and fluorescence intensity at 596 nm (peak) was normalized and plotted.
C. Measurements of heme in the same strains listed as Fig. 9A by acidic acetone extraction. The fluorescence emission of heme was scanned from 400 to 500 nm after excitation at 380 nm and fluorescence intensity at 450 nm (peak) was normalized and plotted.
D. Strain CU1065 Pspac-frvA was grown in LB medium in the absence or presence of 1 mM IPTG. Total RNA was extracted from cells harvested at different growth points as indicated (n=3) and used for reverse transcription and subsequent quantitative real-time PCR to evaluate mRNA expression levels for hemA. The hemA mRNA levels in cells with 1 mM IPTG were presented as fold increase relatively to those of uninduced cells. The data are expressed as the mean ± SD (n=3). *P<0.05 and **P<0.01 indicate a statistically significant difference between the indicated groups.

