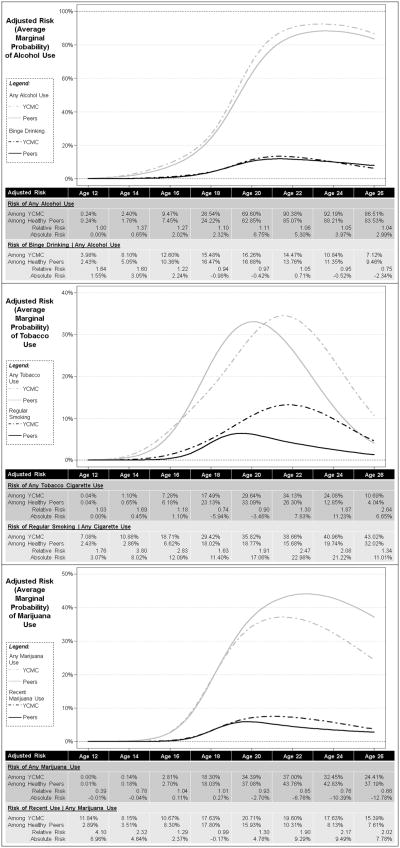
Figure 2. Adjusted risk of substance use behaviors by age and chronic conditions.
Figures show the adjusted risk of use of alcohol, tobacco, and marijuana by age and chronic condition status, derived as the average marginal probabilities as predicted by the multivariate generalized linear mixed models. The inset tables shows the adjusted risk at given ages for youth with chronic medical conditions (YCMC) and their healthy peers, as well as the relative risk and absolute risk difference of use for YCMC compared to their peers. Note that for heavier use, risk depicted in the tables has a denominator of lifetime users and thus is larger than risk graphed on the figures, which depicts the overall risk among the entire sample at a given age (derived as [risk of heavier use | any use] * risk of any use).

