
Figure 3.
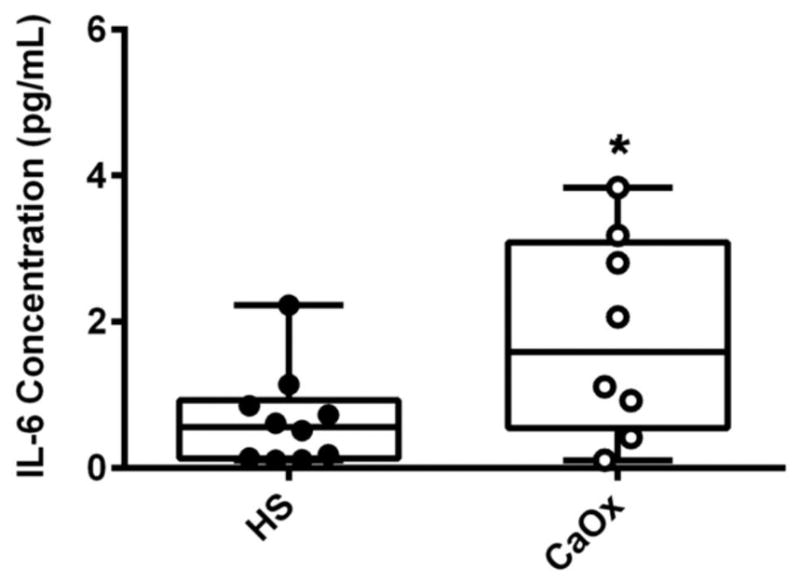
Plasma Interleukin-6 levels in calcium oxalate (CaOx) stone formers (SF) and healthy subjects (HS). Plasma from HS (black circle) and CaOx SF (white circle) were analyzed for the expression of IL-6 using ELISA. Results are represented in a box plot with lower 25th percentile, median, upper 75th percentile, and whiskers drawn at 1.5 × interquartile range; n = 10 healthy subjects and n=8 CaOx SF and presented as mean ± SE; *p<0.05 compared to HS monocytes.