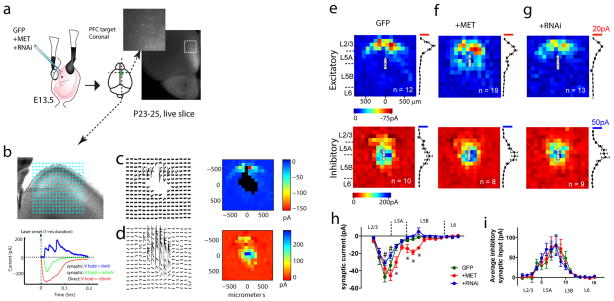
Figure 5. Single neuron alternation in MET signaling during in vivo development disrupts local cortical circuit connectivity.
(a) Experimental paradigm. C57Bl6 embryos were electroporated with MET OE, RNAi plasmids in combination with GFP, or control GFP alone at E13.5. A DIC image of live coronal slice superimposed with the GFP channel was shown to denote PFC L5 neuron targeting by IUEP. (b) Illustration of a sagittal PFC slice prepared from IUEP mice, from which L5 PFC neurons were selected for LSPS mapping. A stimulation grid of 16*16 was overlaid to denote stimulation locations. Glutamate uncaging using UV laser pulses produces three types of responses, a direct response (red trace) when glutamate was uncaged at a location close to the soma or dendrites; a synaptic circuit response (green) when glutamate was uncaged and activated a synaptically connected presynaptic neuronal population; or an inhibitory response (voltage clamped at 0 mV) in the form of outward current from synaptically connected interneurons. (c) An example of a matrix of excitatory synaptic input responses to a L5 PFC neuron electroporated with GFP, in response to glutamate uncaging at locations indicated in b. Note direct responses were not plotted. The pseudo-color representation (i.e. ‘map’) of the location and strength of these responses was shown to the right. (d) An inhibitory response map was collected at 0 mV holding potential following the excitatory map. (e) Averaged excitatory (n = 12 neurons/4 mice) maps from L5 neurons with GFP electroporation. For each individual map, the 16 columns of responses were binned into L2/3, L5A, L5B and L6, and the averaged EPSC and IPSC was calculated for each column. Mean and standard errors of the pooled maps were plotted to the right of the average map. Averaged inhibitory inputs (n = 10/4) and their laminar distribution were shown in the panel below. (f) Averaged excitatory (top panel, n = 19/3) and inhibitory (n = 8/3) maps for L5 PFC neurons electroporated with Met cDNA. (g) Averaged excitatory (top panel, n = 13/4) and inhibitory (n = 9/4) maps for L5 PFC neurons electroporated with MET RNAi. (h) Pooled excitatory synaptic inputs to all groups of L5 neurons as a function of their laminar location. Two-way ANOVA revealed a significant treatment effect (F(2, 656) = 15.8), with significantly increased input strength in MET OE neurons at L5A and L5B (*p < 0.05, Bonferroni post hoc test). In contrast, RNAi neurons showed significantly reduced synaptic inputs from L2/3 (#p < 0.05, Bonferroni post hoc test). (i) Pooled inhibitory synaptic inputs to all groups of L5 neurons as a function of their laminar location. No significant difference was detected for the treatment effects on laminar distribution of inhibitory inputs (F(2, 384) = 0.09. p > 0.05).

