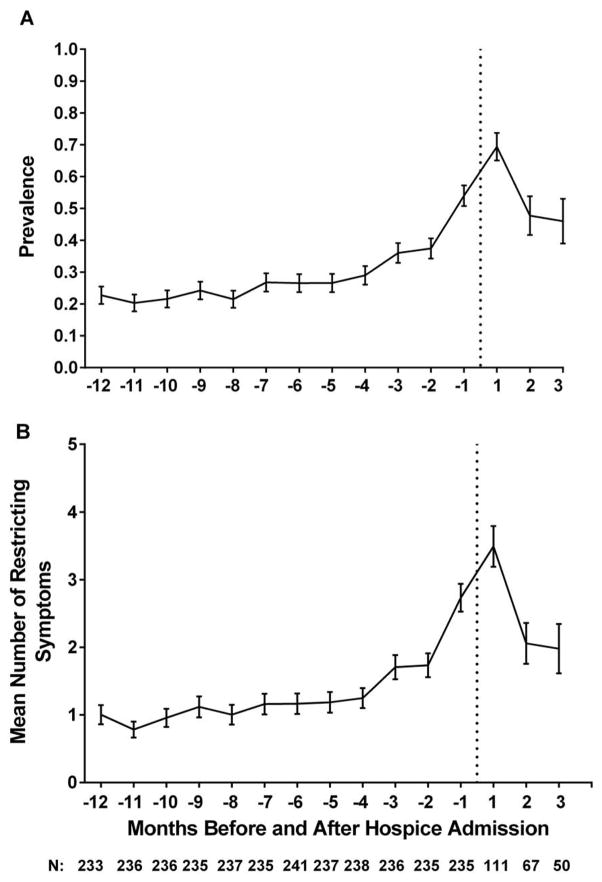
Figure 1.
The Occurrence of any Restricting Symptoms (Panel A) and Mean Number of Restricting Symptoms (Panel B) in the 12 Months before and 3 Months after Hospice Admission. Values for the prevalence of symptoms were calculated by dividing the number of participants who reported any restricting symptoms that month by the total number of participants who completed interviews in the month. Error bars in Panel A represent the asymptotic standard error. Errors in Panel B represent the standard error. The dashed vertical line denotes the time of hospice admission. Months before hospice admission are denoted by negative values, while those afterwards are denoted by positive values. The number of participants varies prior to hospice admission because of missing values and decreases after hospice admission because of deaths.

