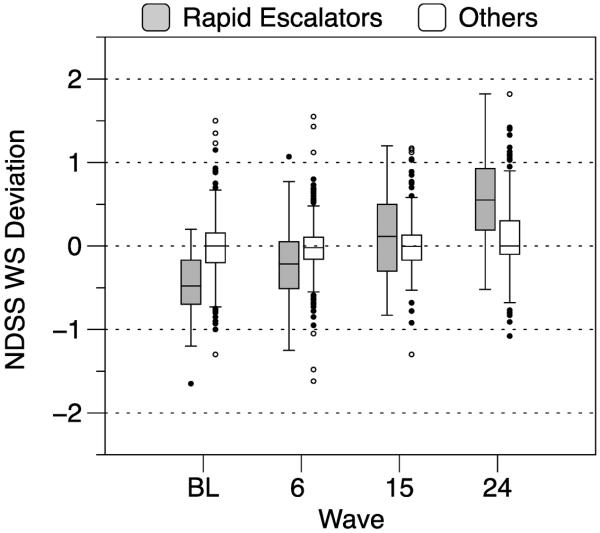
Figure 2.
Distributions of within-person deviations on the NDSS at each study wave by Rapid Escalator status. WS = within-subject; BL = baseline. For each plot, the box depicts the interquartile range and the median, the whiskers extend to the 2.5 and 97.5 percentiles, and the circles show the locations of outliers in the top and bottom 2.5% of the distribution.

