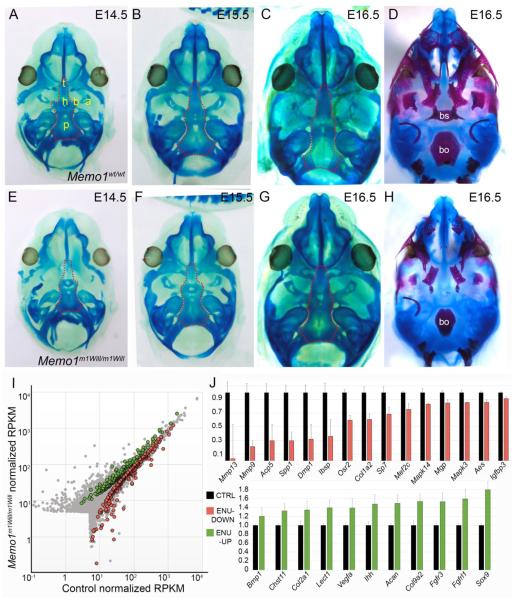
Figure 6. Memo1m1Will mutants show normal chondrocranium development but reduction in regulators of endochondral ossification in the cranial base.
(A-H) Ventral views of the developing cranial base with mandible removed, in control (A-D) or Memo1m1Will mutants (E-H). Samples are stained with either alcian blue alone for cartilage (A-C, E-G), with the dotted outline highlighting the cranial base, or alcian blue plus alizarin red, marking cartilage and bone (D, H). (I) Scatter plot depicting average RPKM (reads per kilobase per million mapped reads) values of RNAseq conducted on RNA isolated from E15.5 cranial bases (similar to outlined area in B and F) of control (X-axis) or Memo1m1Will mutants (Y-axis) (3/group). Colored points represent transcripts that are statistically significant between groups (Green: up-regulated in Memo1m1Will, ~220 genes; and red: down-regulated ~300 genes). (J) Upper panel: histogram plotting normalized RPKM values of genes associated with endochondral ossification and significantly down-regulated in Memo1m1Will mutant cranial base samples as compared to controls. Lower panel: same as upper panel, but plotting significantly up-regulated genes from Memo1m1Will cranial base samples as compared to controls and associated with cartilage development. Error bars represent standard error calculated from 3 replicates. Abbreviations: a, ala temporalis cartilage; b, basitrabecular process; bo, basioccipital; bs, basisphenoid; h, hypophyseal cartilage; p, parachordal cartilage; t, trabecular cartilage (trabecular plate).

