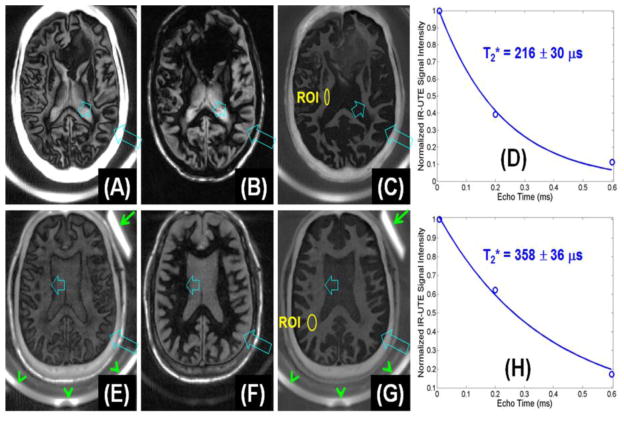
Figure 4.
IR-UTE imaging of the brain from a 64 year old female donor (TR/TI = 1500/410 ms) with confirmed MS with TEs of 8 μs (A), 2.2 ms (B) and subtraction image (C). Single-component fitting (D) shows a T2* of 216±30 μs for an ROI drawn in the NAWM shown in (C). IR-UTE imaging of a 60 year old male volunteer (TR/TI = 1500/412 ms) with TEs of 8 μs (E), 2.2 ms (F) and subtraction image (G). Single-component fitting (H) shows a T2* of 358±36 μs for an ROI drawn in the NAWM shown in (G).

