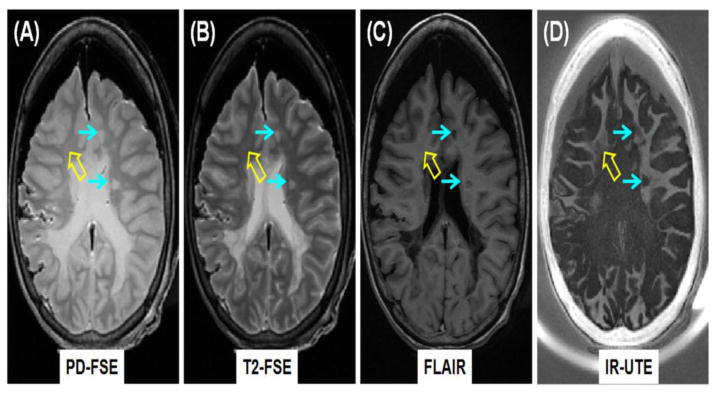
Figure 5.
Clinical PD-FSE (A), T2-FSE (B) and FLAIR (C) imaging as well as IR-UTE (TR/TI = 1500/410 ms) (D) imaging of a brain specimen from a 28 year old female donor with confirmed MS. MS lesions are hyperintense (thin arrows, A, B) on the PD-FSE and T2-FSE images, and hypointense (thin arrows, C) on the FLAIR image, and show signal loss on the IR-UTE image (thin arrows, D). Complete myelin loss is obvious in regions indicated by the thin arrows. Partial loss of signal is seen in the IR-UTE image (thick arrow, D) where the PD-FSE, T2-FSE and FLAIR images appear normal (thick arrows, A–C).

