
Figure 3.
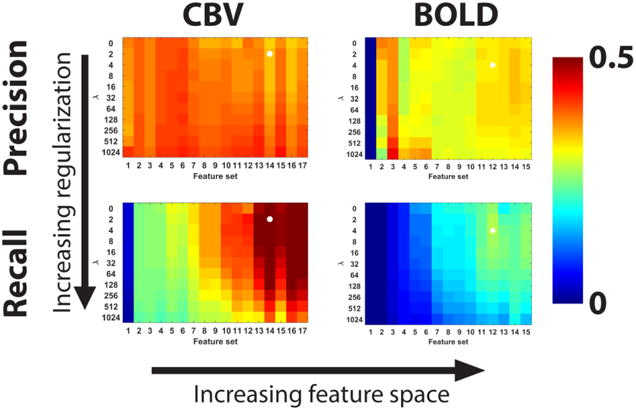
Summary of precision and recall for all tested models in the cross-validation data set. Each matrix displays the precision or recall for every candidate model, where the models were varied by altering the regularization and feature space. The optimum model was selected by maximizing recall, which is indicated by white circles in the matrices.