
Figure 4.
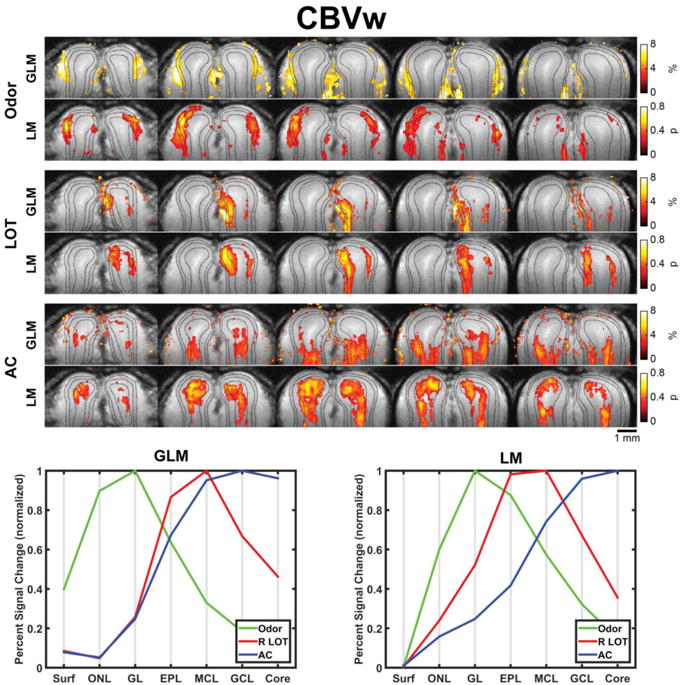
Mean activation maps and line profiles (n=4 animals) calculated using CBVw test data and either a general linear model (GLM) or the learned model (LM). Top: Each row of images shows the mean activation maps for one of the three stimulation paradigms overlaid on the mean anatomical image, with the five slices arranged from anterior to posterior positions. The activation maps are thresholded such that the largest n values are shown, where n was chosen to have the same number of nonzero voxels as the number of voxels in the expected layer of activity. Unthresholded maps are shown in Supplemtary Figure 2. Dashed lines indicate the outer and inner boundaries of GL and the outer boundary of MCL. Bottom: Summary plot showing the mean percent change or probability active in each layer for each stimulation paradigm following normalization by the maximum value and then averaging across animals.