
Figure 6.
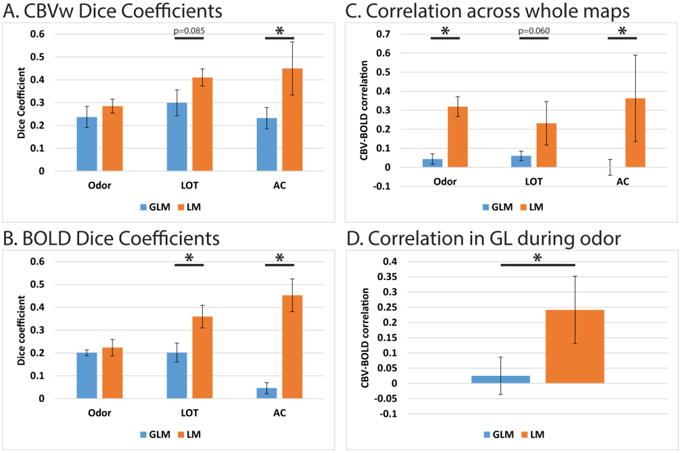
On the left are Dice coefficients comparing maps of the expected layer of activity and the thresholded activation maps for each stimulation paradigm using the general linear model (GLM) and learned model (LM), both for CBVw data (A) and BOLD data (B). Graphs on the right summarize the agreement in activation maps between CBVw and BOLD data, using either the GLM or LM. Graph C shows the Pearson correlation between CBVw and BOLD activation maps using the entire image. Graph D shows the Pearson correlation between CBVw and BOLD activation maps only within the glomerular layer during the odor stimulation. All bars and error bars represent the mean ± standard deviation (n=4 rats). Differences between the GLM and LM were tested by a paired T-test (*p<0.05)