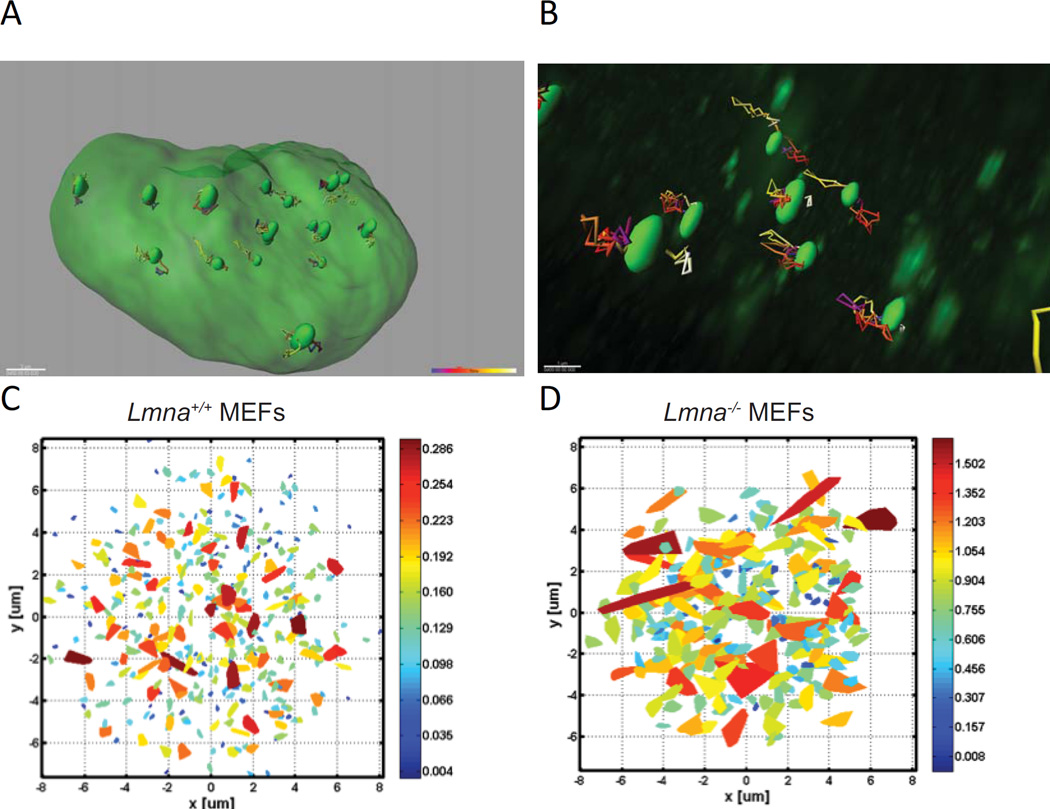
Figure 3. Telomere dynamics.
(A) Image shows overall telomere trajectories in one nucleus of U2OS cells expressing GFP-TRF1. Each green oval highlighted within the larger green nucleus represents the domain occupied by a single telomere. Full 3D images were captured every 25 seconds with a confocal microscope to measure telomere dynamics. Multicolor paths extending from each green oval represent the reconstructed motion of that telomere as determined by IMARIS, a 3D/4D image processing software. Approximately 100 time points are observed for each telomere. This random motion can be further analyzed in order to extract the actual type of the diffusion motion. (B) Magnification of a 3D image to highlight the multi-colored mobility tracts of a few telomeres (green ovals) within a single nucleus. (C) The area scanned by telomeres in MEFs Lmna+/+ as calculated from the motion of each telomere during 35 minutes. Data were measured in 3D with a confocal microscope, and the projection images were calculated. The color is an indication of the scanned volume size, with the scaled heat map colors shown to the right of the panel. Each trapezoid represents the extent of the nuclear volume traversed by a single telomere during the experiment. Each image shows the projection of telomeres measured from 15–20 cells (≈200 telomeres are shown). (D) Area scanned by telomeres (≈200 telomeres shown) in Lmna−/− MEFs calculated as in (C). Note the dramatically expanded trapezoid areas and larger scale values compared to (C).

