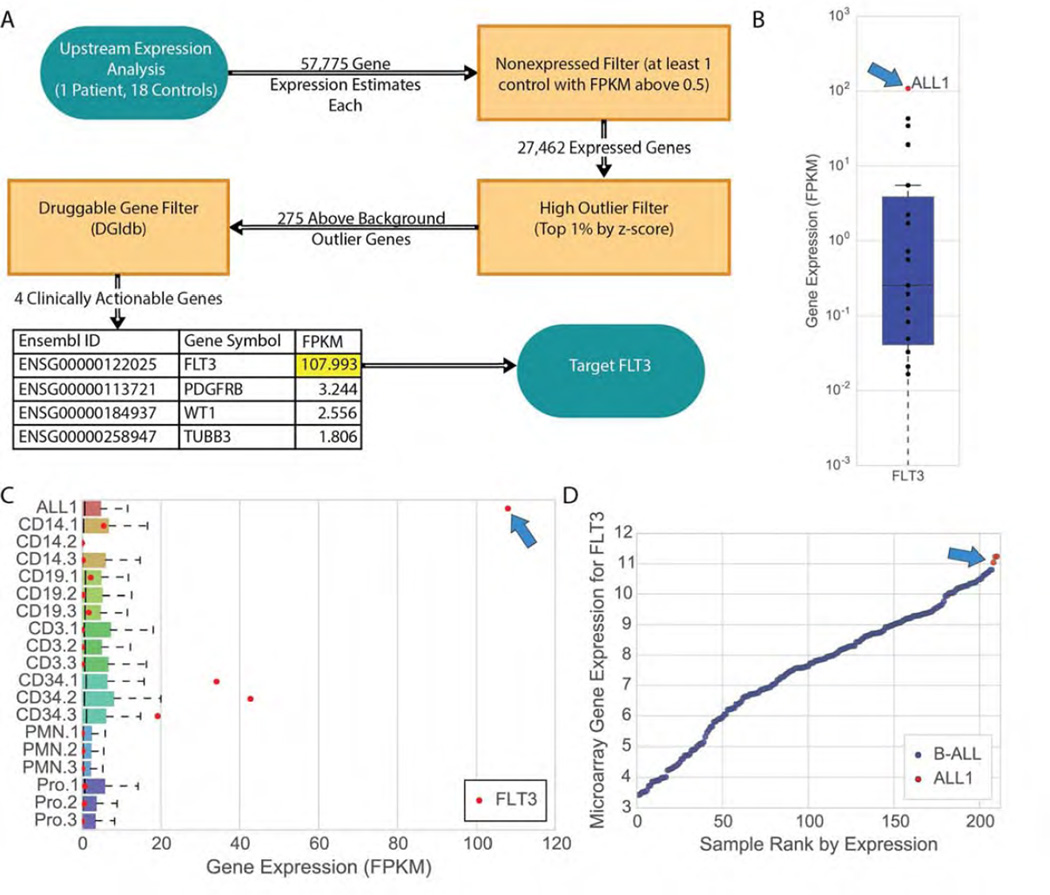
Figure 3. Transcriptome analysis of second relapse reveals aberrant expression of FLT3.
(A) Analysis of the ALL1 transcriptome compared to sorted blood cells from 18 healthy individuals (Methods) revealed FLT3 as an important and clinically actionable target. (B) Evaluation of the expression levels of FLT3 in ALL1 versus the healthy control-derived blood cells reflects a difference of several orders of magnitude. (C) FLT3 expression is an outlier across all expressed genes in ALL1, a statistical anomaly otherwise observed only in hematopoietic progenitor (CD34+) cells, and at a magnitude several times higher than in those cells. Legend for control samples: CD14+ (monocytes), CD19+ (B-cells; CD33−/CD19+), CD3+ (T-cells; CD33−/CD3+), CD34+ (hematopoietic progenitors), PMN (neutrophils; CD33−/CD15+/CD16+), and Pro (promyelocytes; CD14−/CD15+/CD16low/−). (D) Microarray evaluation of ALL1 and 207 childhood B-ALL samples reveals that FLT3 is more highly expressed in ALL1 than in any other B-ALL sample in the pediatric study. The three red points shown for ALL1 represent technical replicates run on the same microarray expression platform as the 207 B-ALLs (Affymetrix Human Genome U133 Plus 2.0 Array, Methods).

