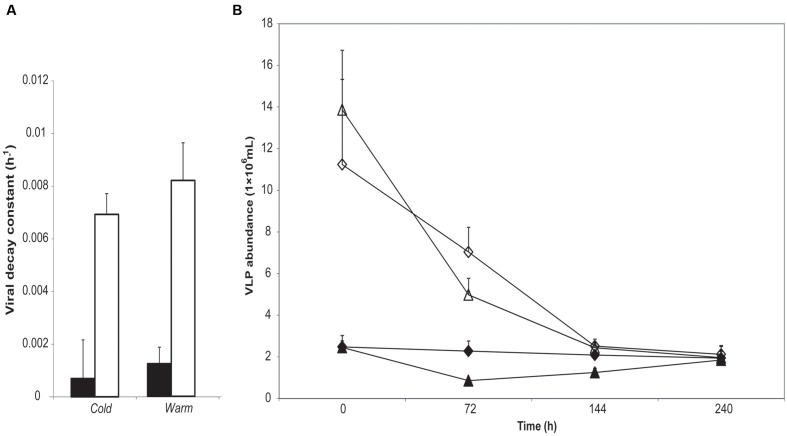
FIGURE 1.
(A) Mean viral decay rate k (h-1) calculated from changes in virus-like particle (VLP) abundance over the course of 10 days incubation of either supraglacial stream water (gray bars) or proglacial lake water (white bars). (B) Changes in VLP abundance over 10 days of supraglacial stream water (dark symbols) and proglacial lake water (clear symbols) incubated in stream (Cold; diamonds) or lake (Warm; triangles). No effect of incubation temperature manipulation (by reciprocal transplant) is apparent, while the water source results in highly significant differences in k (Kruskal–Wallis: H = 22.93, p < 0.001). Error bars represent ±1 SD.

