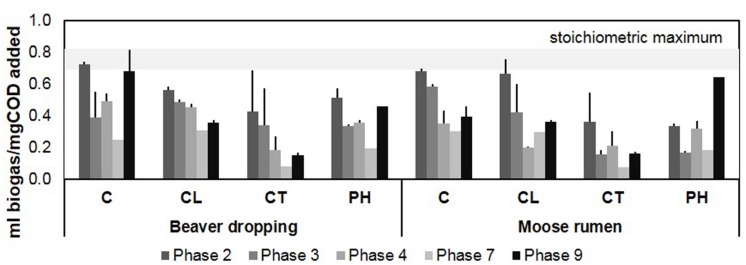
FIGURE 1.
Biogas production profile of microcosms fed with various lignocellulosic carbon sources for over 3 years. The range of stoichiometric maximum biogas yield is shown in the gray band to provide a reference for the conversion extents of the fed substrates in the microcosms [see supplemental methods for the calculation based on Buswell’s formula (Symons and Buswell, 1933)]; error bars indicate standard deviation; n = 3. C, cellulose; CL, cellulose + lignosulphonate; CT, cellulose + tannic acid; PH, poplar hydrolysate.

