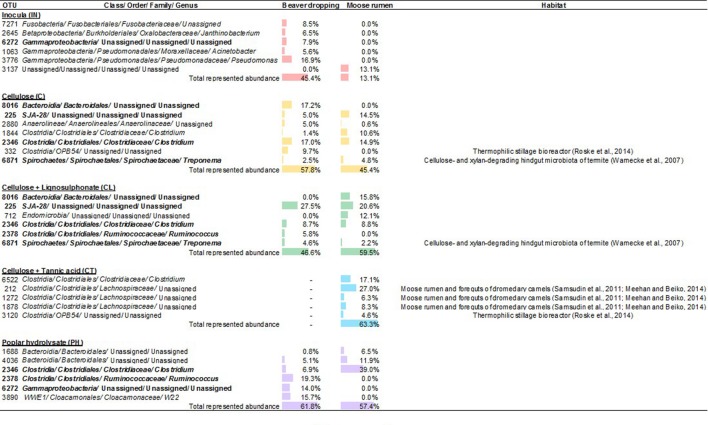
FIGURE 5.
Abundant OTUs from enrichment microcosms fed with various lignocellulosic carbon sources. Abundances (≥ 4% in at least one sample) are indicated by the relative length of data bars, which are color coded to represent the inocula (red), and enrichment microcosms fed with cellulose (yellow), cellulose + lignosulphonate (green), cellulose + tannic acid (blue), and poplar hydrolysate (purple).

