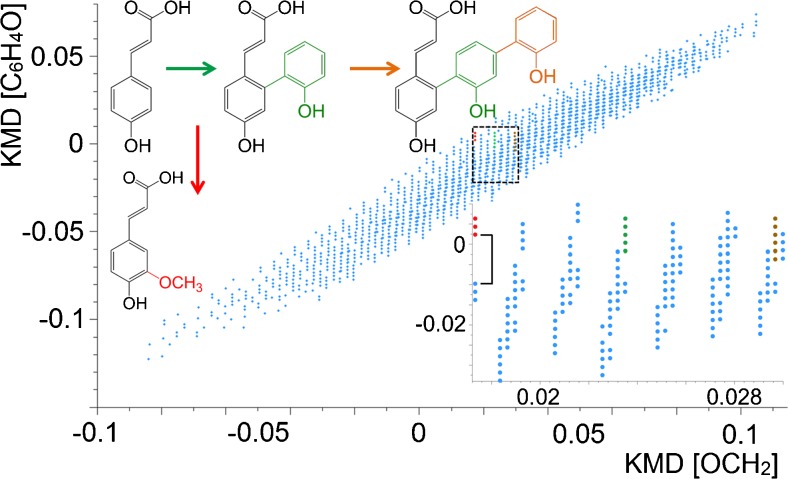
Fig. 3.
2D mass defect matrix plot for a lignin sample after decomposition. Blue data points represent features in the KMD plot and correspond to degradation products from the sample. The squared area is enlarged (inset) and proposed core structures of the three compound species (red, green, brown) are highlighted in the expanded plot

