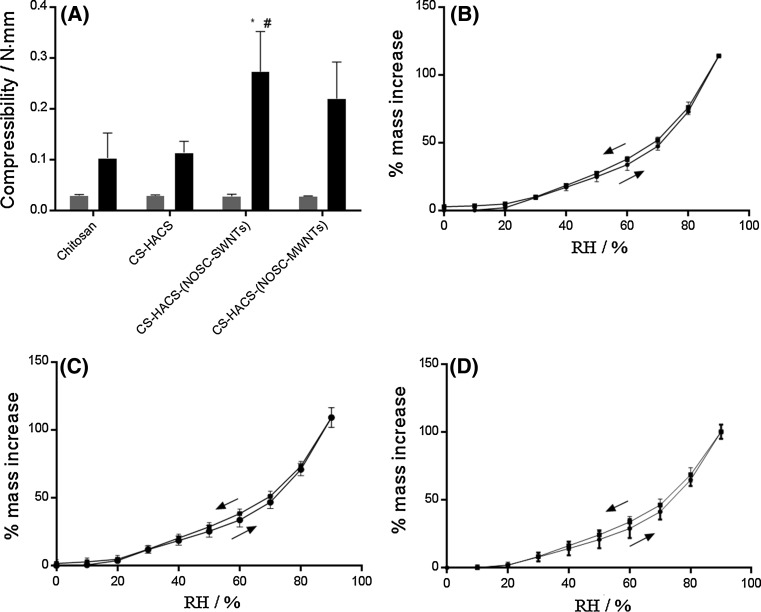
Fig. 1.
a Compressibility of the different formulations before (grey) and after (black) sol–gel transition. Results are reported as mean ± SD (n = 3). One way ANOVA (α = 0.05) on the values after gelation returned P = 0.0131; Tukey’s multiple comparisons test: * P < 0.05, compared to chitosan; # P < 0.05 compared to CS-HACS. Water sorption and desorption isotherms of the freeze dried hydrogels: b chitosan; c CS-HACS-(NOSC-SWNTs); d CS-HACS-(NOSC-MWNTs). Data are presented as mean ± SD (n = 3)

