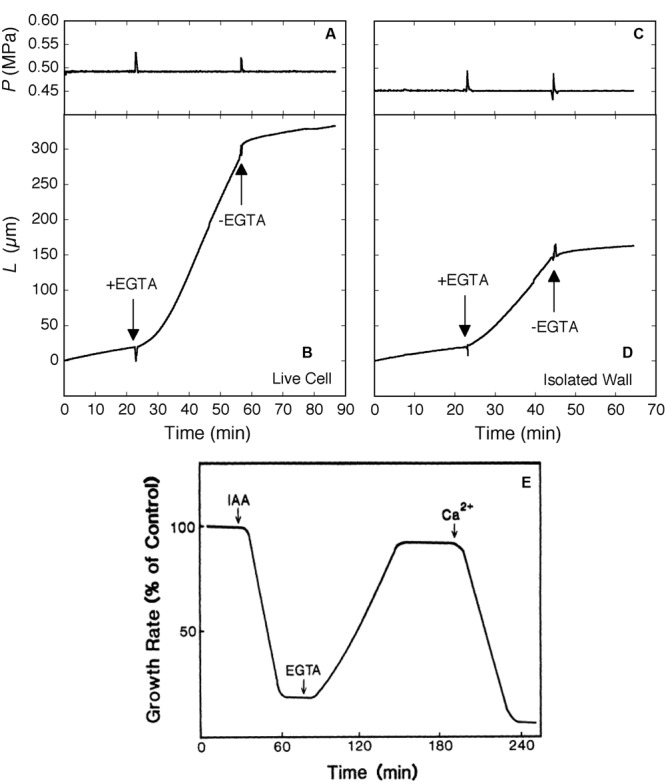
FIGURE 4.

Elongation in Chara corallina internodes (A–D) and maize roots (E) exposed to the Ca2+ chelator EGTA (downward arrows). In Chara, the EGTA (2.5 mM, pH 7) removed 95% of Ca and 100% of Mg from the wall. Ca2+ (0.6 mM) was resupplied when EGTA was removed with fresh culture medium (upward arrows). Turgor pressure (P) is shown in (A) and (C), change in length of internodes (L) in (B) and (D) for live Chara cells and isolated walls, respectively. In maize (E), roots were exposed to a growth-inhibiting concentration of IAA (10 μM) and subsequently to EGTA (1 mM), then to Ca2+ (0.5 mM). Root growth is shown as % of control rate. (A–D) from Proseus and Boyer (2006c) and (E) from Hasenstein and Evans (1986) by permission from www.plantphysiol.org, Copyright American Society of Plant Biologists.
