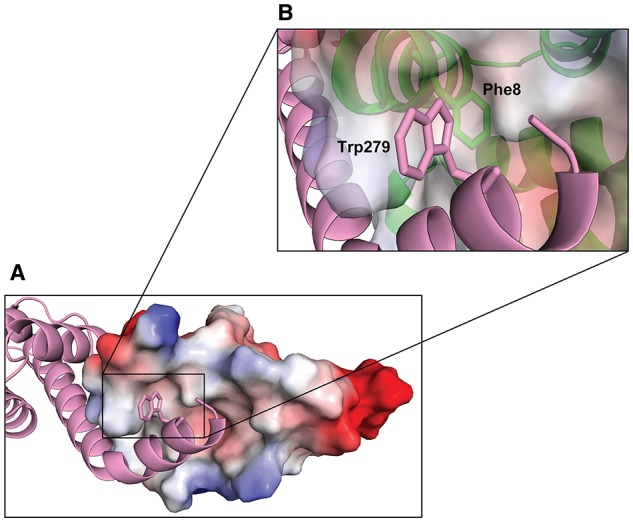
Figure 7.

Hydrophobic interaction between the C-terminus of YopN and TyeA. TyeA is shown by electrostatic surface potential representation with negatively (red) and positively (blue) charged residues (A). The C-terminal chain of YopN (magenta) is shown by ribbon view with Trp279 locating in the TyeA hydrophobic pocket. The insert (B) is a close up view of the TyeA hydrophobic pocket highlighting the close proximity between TyeA(Phe8) and YopN(Trp279).
