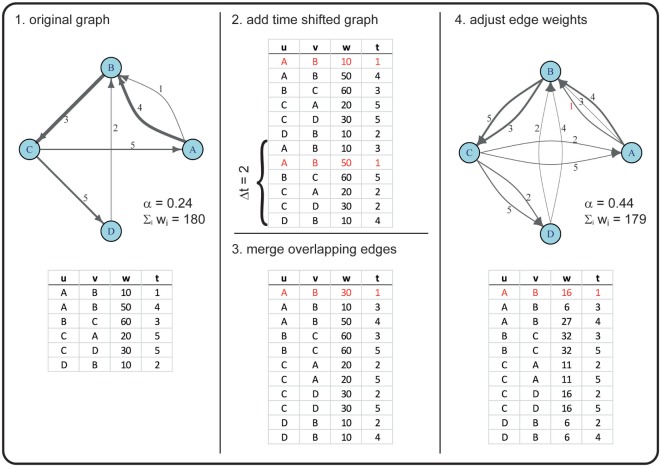
Figure 2.
Example for creating a graph with an increased α using a time shift of two time steps. In this example, the original graph has |V| = 4 nodes (A, B, C, D) and |ℰ| = 6 directed edges (with u as the starting node and v as the receiving node), corresponding to |E| = 5 in the time-aggregated network. The edges are active at times t ϵ {1, 2, … , 5} (numbers next to the drawn edges), thus T = 5. The line widths of the edges correspond to the edge weights w. Overlapping edges (i.e., edges with the same u, v, t) are marked in red. The newly generated graph has the same number of nodes, but an increased number of edges (|ℰ| = 11). Note that, due to rounding errors, the sum of edge weights in the original and the new graph are only approximately equal.

