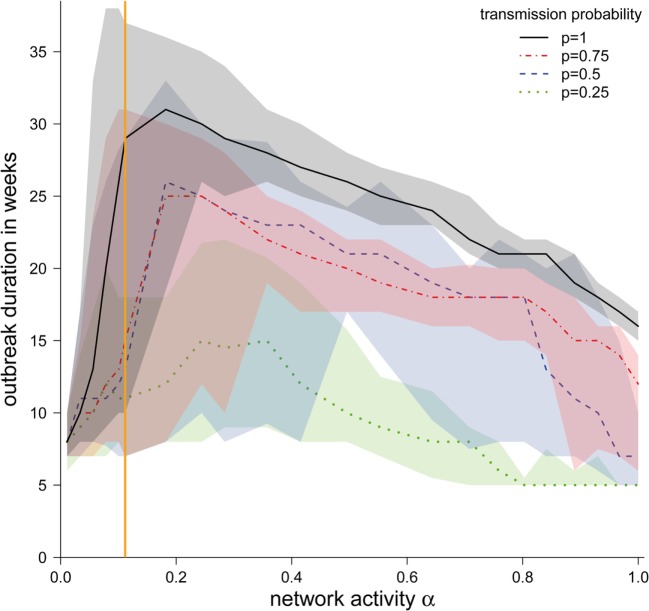
Figure 5.
Median duration of the epidemic in weeks (in the case the disease spread beyond the starting node) ± quartiles (Q1 and Q3) depending on the network activity level α for different disease transmission probabilities p. The vertical orange line represents α for the observed pig trade network 𝒢*.

