Figure 1.
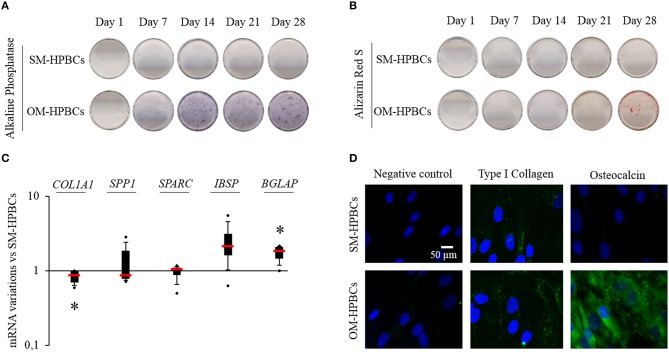
Osteogenic differentiation (A–D). (A) Representative photographs of alkaline phosphatase staining of SM- and OM-HPBCs after 7, 14, 21, and 28 days of culture, (B) alizarin red staining of SM- and OM-HPBCs after 7, 14, 21, and 28 days of culture, and (C) expression of osteogenic genes by OM- compared to SM-HPBCs after 14 days of culture (mRNA were evaluated by RT-qPCR analysis, data were shown as specific variation in mRNA using the 2−ΔΔCt method (HPRT-1 was used as internal control), * means p < 0.05 vs. SM-HPBCs). (D) Representative micrographs of 21-day immunofluorescent staining of cultured cells: type I collagen and osteocalcin were visualized in green with Alexafluor®488. Nuclei were counterstained in blue by DAPI. Scale bar = 50 μm. Experiments were performed on four independent donors.

